July 27th, 2023
We are happy to announce our newest release of Pipeliner CRM.
This release includes another exciting batch of new features for our app as well as other improvements to existing functionality.
Please note that some of these features are only available for our Business, EnterpriseEnterprise Enterprise (in the context of sales) is a relatively large organization typically composed of multiple levels, locations, and departments which need multi-layer software systems that support collaboration across a large corporate environment., or Unlimited Tiers.
Brand New Pivot Table Features
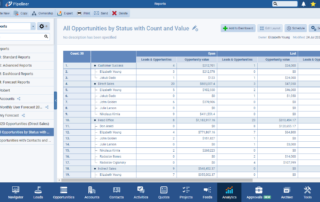
There is a new section available within Pivot tables called “Values“. Users are now able to add several compatible fields to calculate “Values” inside Pivot Tables. So, for example, you can see both the count of opportunities and the sum of their values for each “Status“. ⤵
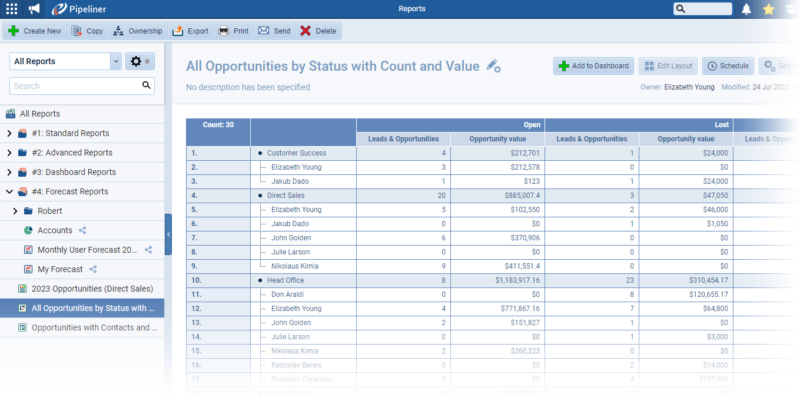
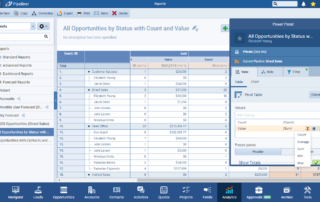
The aggregation function of every added “Value” can be changed directly from the interface. ⤵
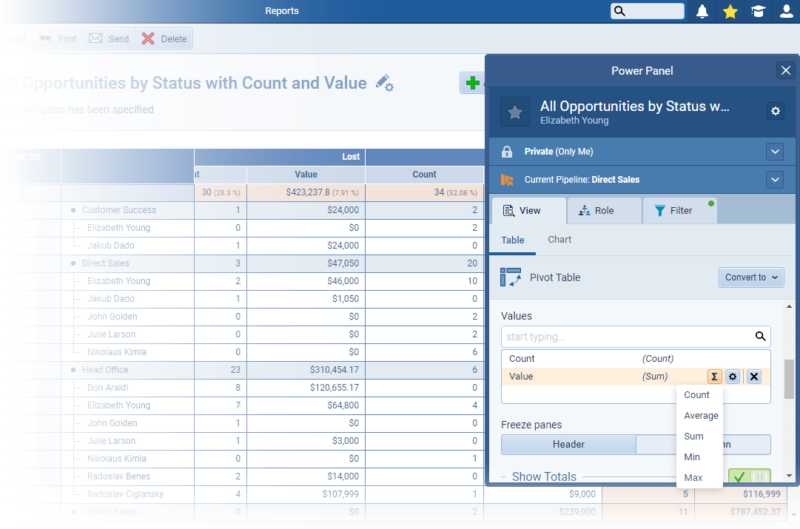
When several values have been added, users have the option to change “Value” names for easier readability within your report by clicking the gear icon beside each field in the “Values” section.⤵
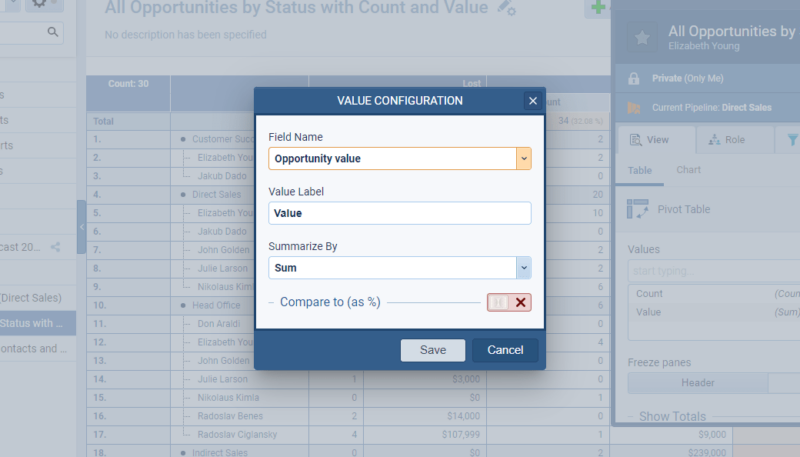
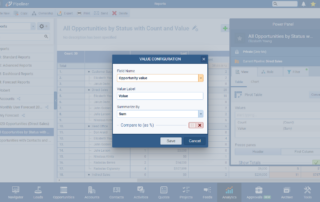
In the resulting “Value Configuration” box, users can change the “Field” to be used, the “Value Label“, and the “Summarize” by function and can also enable the “Compare To (as %)” option to display values as a percentage of a selected total. ⤵
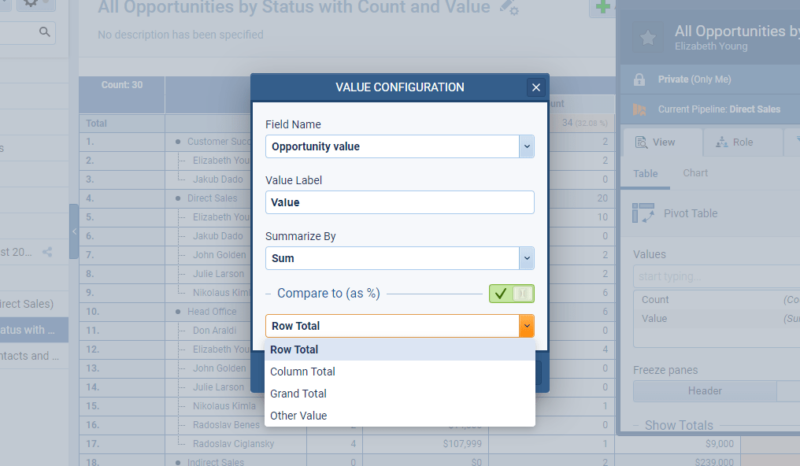
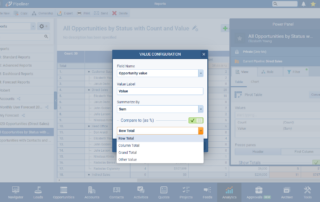
The “Compare To (as %)” function allows users to compare values inside the pivot table and represent the comparison as a percentage.
Options:
- Row Total — takes the value that is in the Row Total cell and compares it to the value in the pivot table cell, displaying the result as a “%”.
- Column Total — takes the value that is in the Column Total cell and compares it to the value in the pivot table cell, displaying the result as a “%”.
- Grand Total — takes the value that is in the Grand Total cell and compares it to the value in the pivot table cell, displaying the result as a “%”.
- Other Value — the UserUser User means a person who uses or consumes a product or a service, usually a digital device or an online service. can select a field of their choice to compare Values to.
Examples of comparisons users might apply are:
- “Won Amount” vs “Total Sales Amount“.
- “Count” of leads vs “Total Count of Leads“.
Check our Knowledge Base article to get more information about Pivot Tables ›
Window Minimization
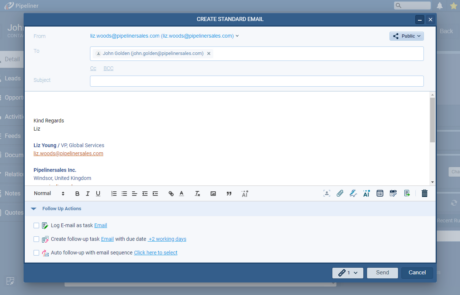
Users are now able to minimize Emails and Notes while composing them. ⤵

As part of our ongoing usability enhancement program, we’ve updated the following features.
Various Improvements
When creating a “Task” or “Appointment” from a Step Activity associated with a “LeadLead Lead refers to a prospect or potential customer (who can be an individual or organization) that exhibits interest in your service or product; or any additional information about such entity.“, “Opportunity” or “Quote Process“, the activity is now automatically linked to the Primary AccountAccount Account refers to a record of primary and background information about an individual or corporate customer, including contact data, preferred services, and transactions with your company. and/or Primary Contact as well as the Lead, Opportunity or Quote itself.
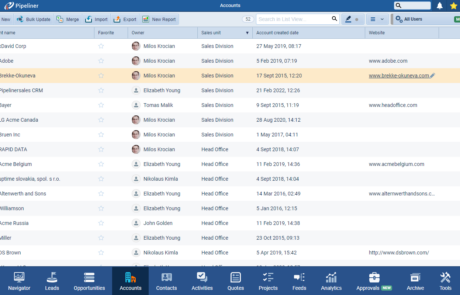
If you add a “URL” field to a List View — website, for example — the field will now be clickable directly from the List View. ⤵

Gallery of all improvements

Pipeliner CRM is getting better and better with each new release. If you’re curious, about what other releases we had, please visit our “Release Notes” section.
Theory Made Real
Based on proven economic principles, Pipeliner CRM is a tool for everyone. Read more

