October 20th, 2022
We are happy to announce our newest release of Pipeliner CRM.
This release includes another exciting batch of new features for our app as well as other improvements to existing functionality.
Please note that some of these features are only available for our Business, EnterpriseEnterprise Enterprise (in the context of sales) is a relatively large organization typically composed of multiple levels, locations, and departments which need multi-layer software systems that support collaboration across a large corporate environment., or Unlimited Tiers.
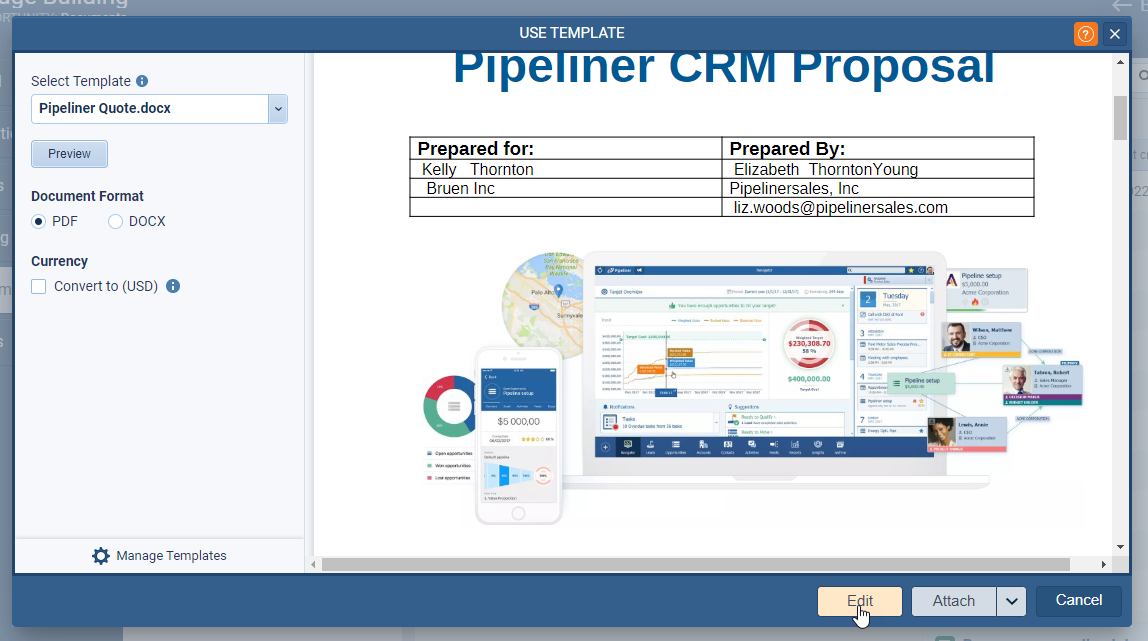
Document TemplateTemplate Template is a generic file with a framework showing the standard sections or features of a specific kind of document, used to create a new document of the same type faster and easier. Preview (with edit functionality)
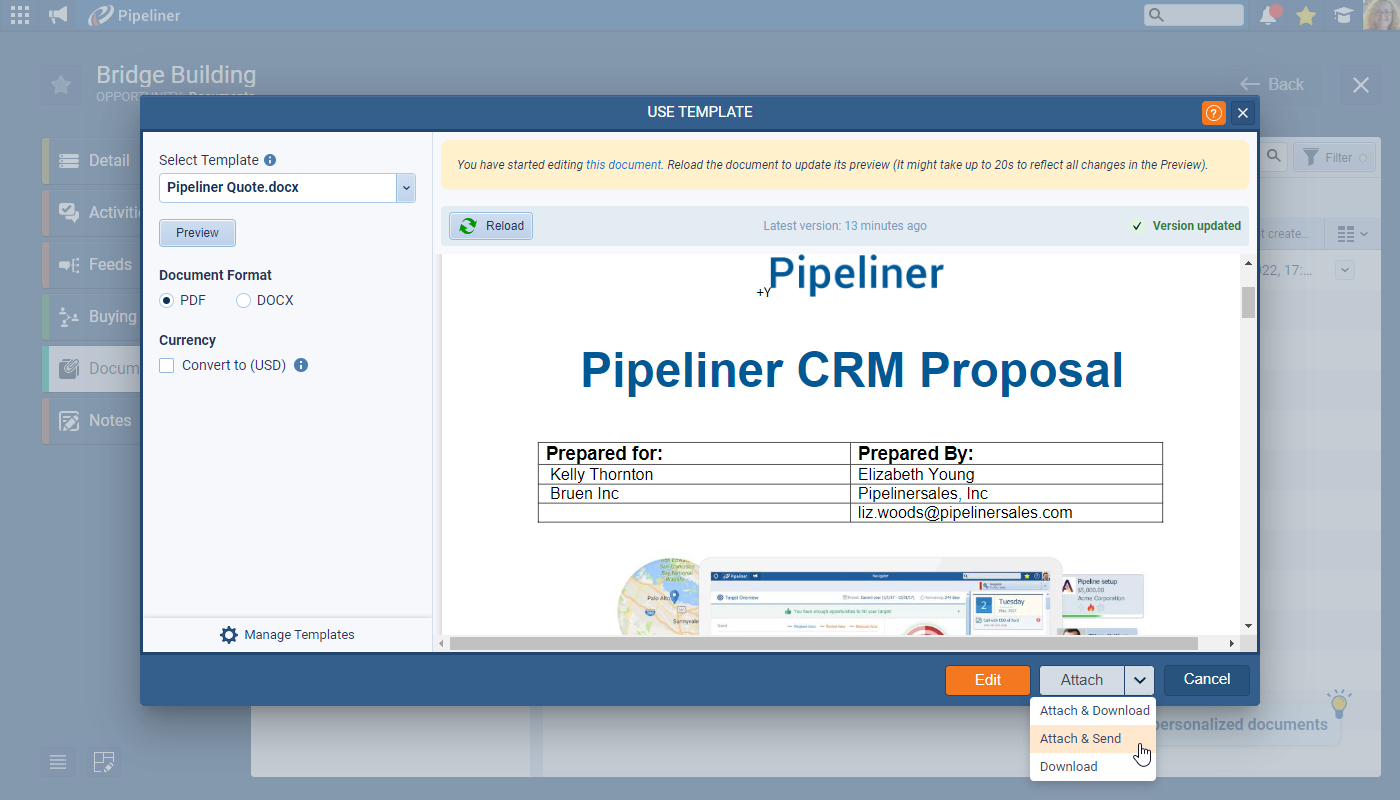
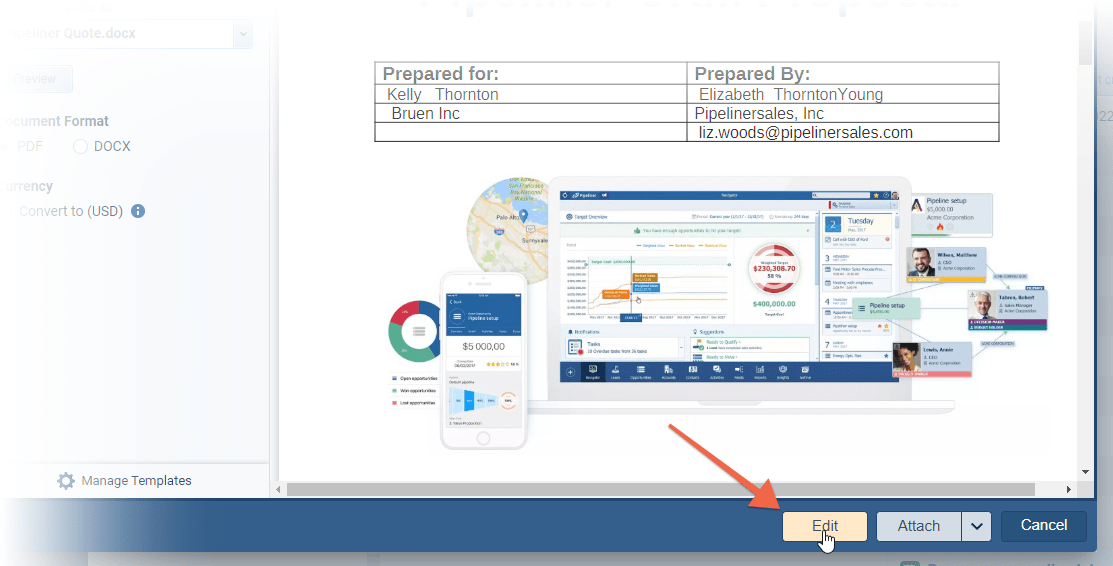
This release contains some really useful enhancements for customers using Office 365 templates within Pipeliner. Users can now “Preview” the completed file (document or spreadsheet) from within the “Documents” tab and if they see anything that needs to be changed, as long as either the OneDrive or Sharepoint integration is enabled, users will be able to “Edit” the file directly and “Reload” the “Preview” to view amendments. ⤵
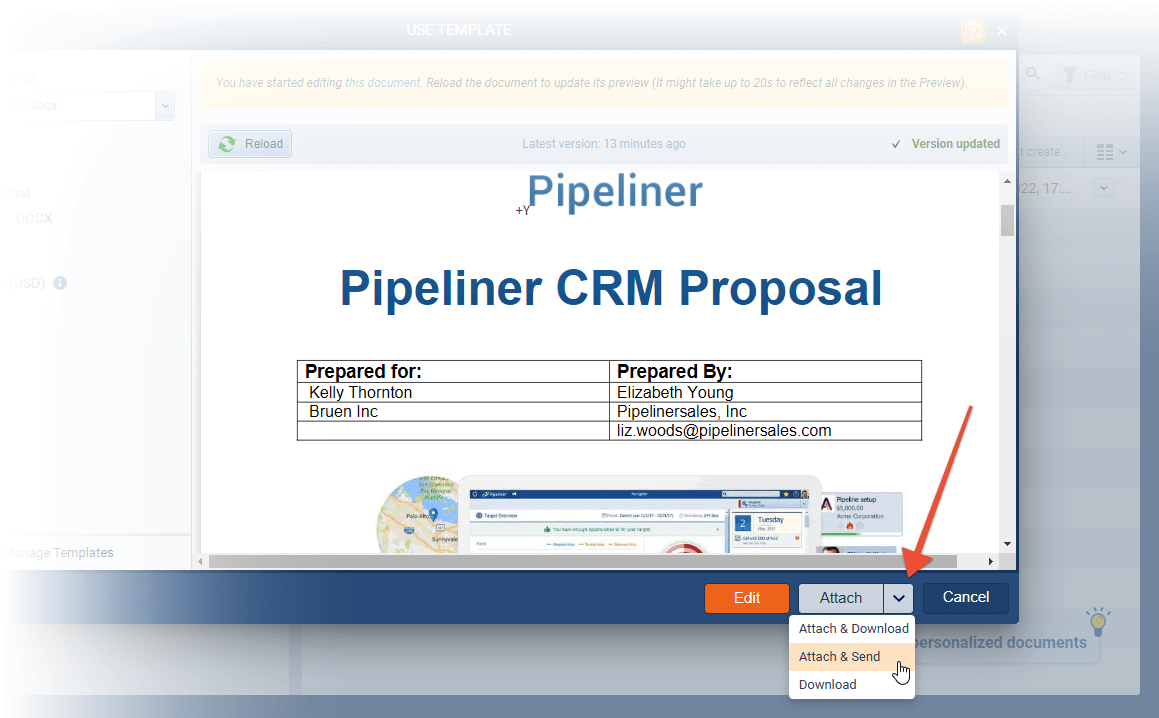
Once users are happy with the template, they can use a new option “Attach & Send” to send it directly via email rather than having to attach it and then send it via email separately. ⤵
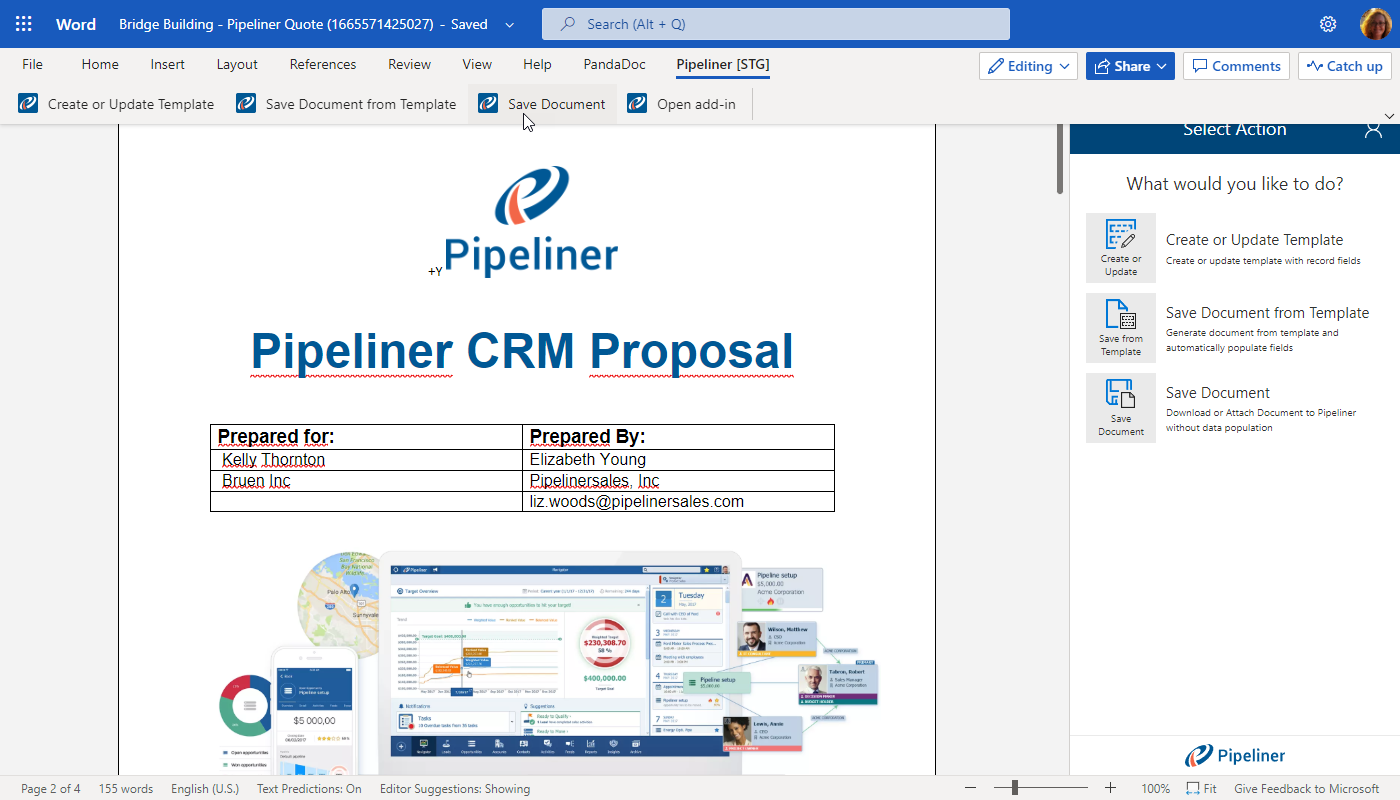
If users are already working on a file in Word or Excel, the “Pipeliner Templates” add-in now has an option to “Save Document” directly to a selected record inside Pipeliner rather than having to download it and then attach it. ⤵
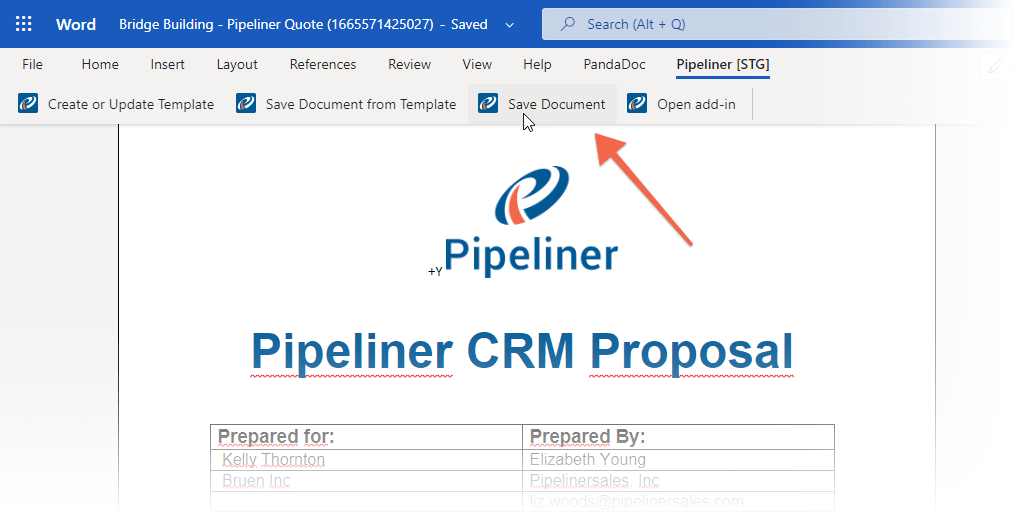
“Manage Templates” allows admins to keep track of all templates and also to “Deactivate” templates that should no longer be selected by users.
Check our Knowledge Base article to get more information about Document Template Preview ›
Highlighting Changes
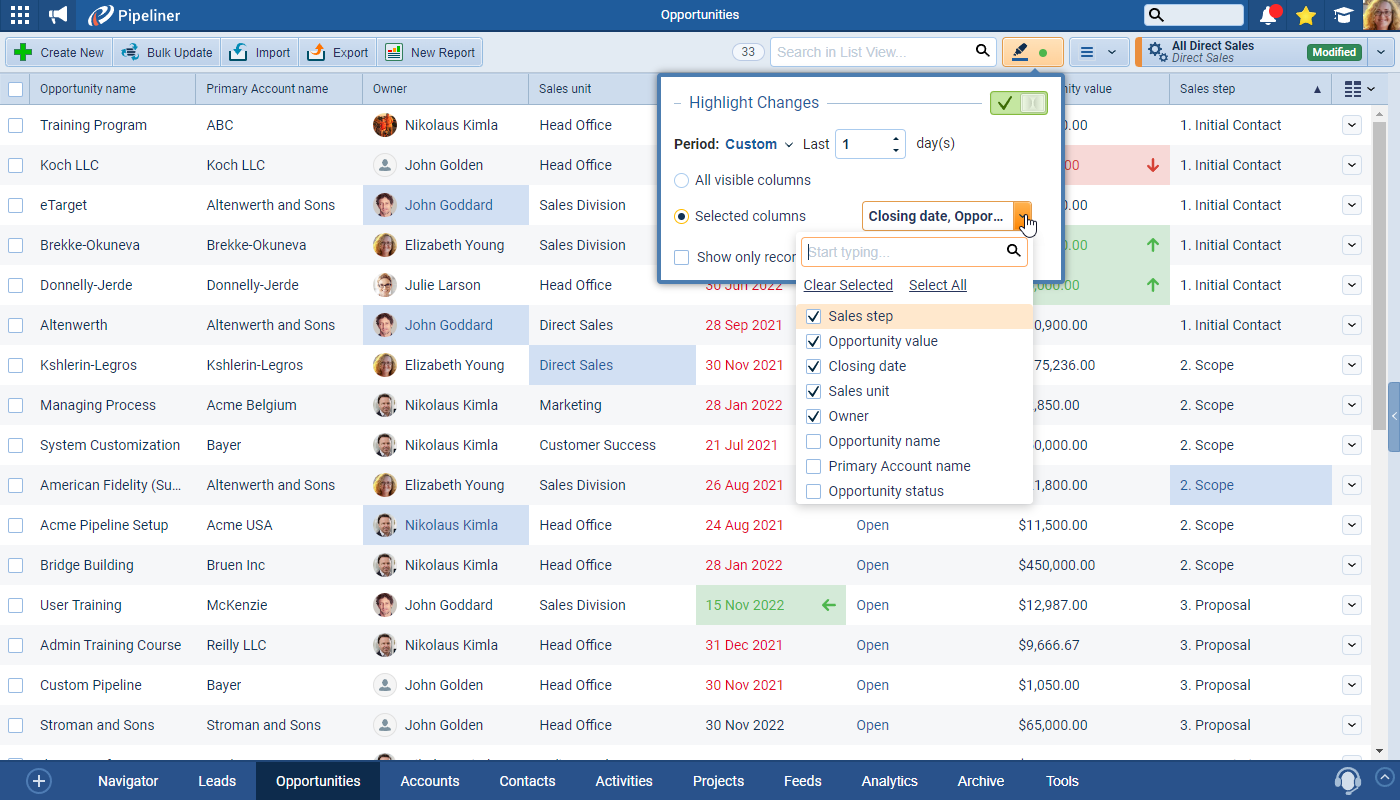
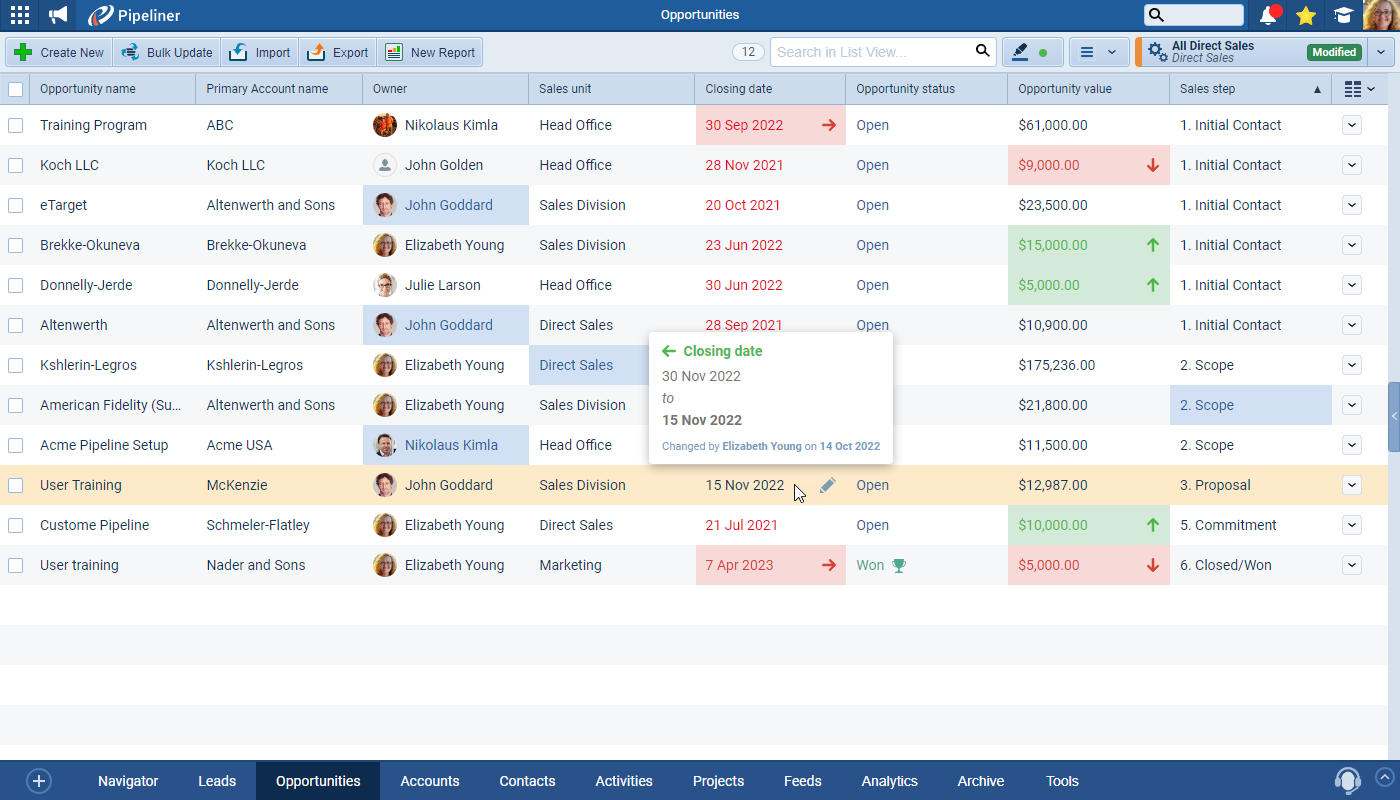
“Highlight Changes” allows users to highlight changes made within a chosen date period to all — or specifically selected — fields within a “List View”
The date “Period”can be selected from one of the preset ranges a “Custom” number of days can be chosen and changes displayed for all fields in the List View or just selected fields. ⤵
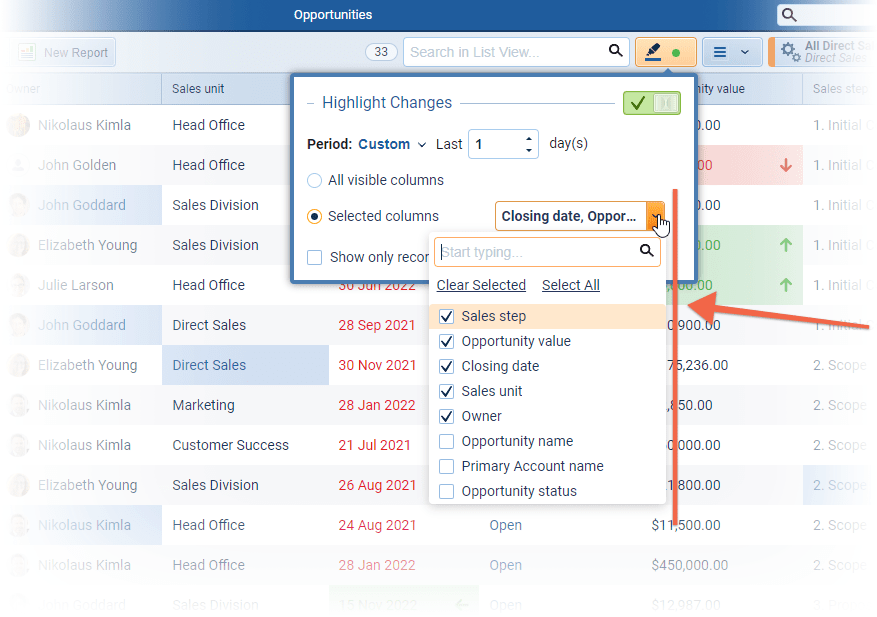
Some system fields that are not included in the audit visible from the “View Changes” button are also not available when highlighting changes.
A filter can be enabled to show only records with changes made to selected fields within your date period by ticking “Show only records with highlighted changes”.
The highlighted changes display as follows:
- If your chosen field holds numeric or currency values…
- …if there is a positive change to a higher value, the cell is highlighted green with an upward arrow.
- …if there is a negative change to a lower value, the cell is highlighted red with a downward arrow.
- …changes from or to an Empty value are blue without an arrow.
- If your selected field holds a date value…
- …if the date is moved back so it’s sooner than it was/brought forward, the cell is highlighted green with a left pointing arrow.
- …if the date is moved so it’s later than it was/pushed back, the cell is highlighted red and there is a right pointing arrow.
- …changes from or to an Empty value are blue without an arrow.
- Other fields…
- …changed cells are highlighted blue.
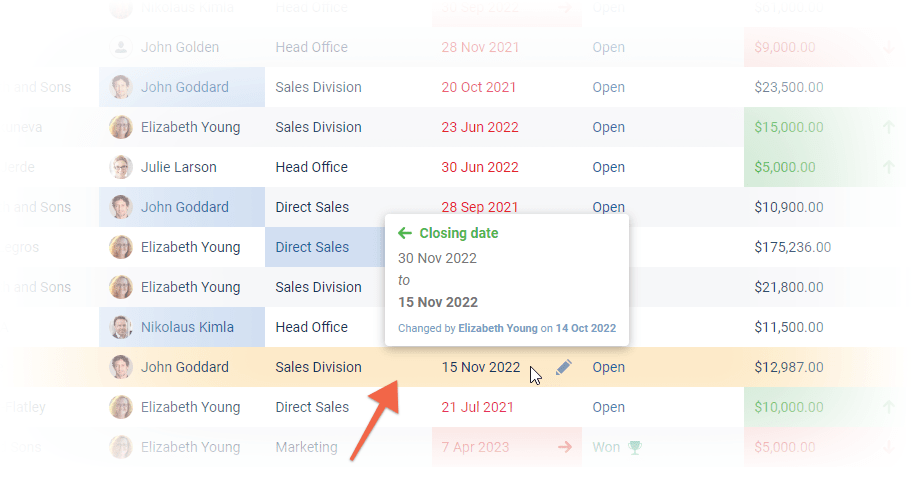
Users can hover over a highlighted field to see a tooltip which shows the name of the field, its previous and new values and who made the change and when. ⤵
Check our Knowledge Base article to get more information about Highlighting Changes ›
Office 365 Tasks Integration
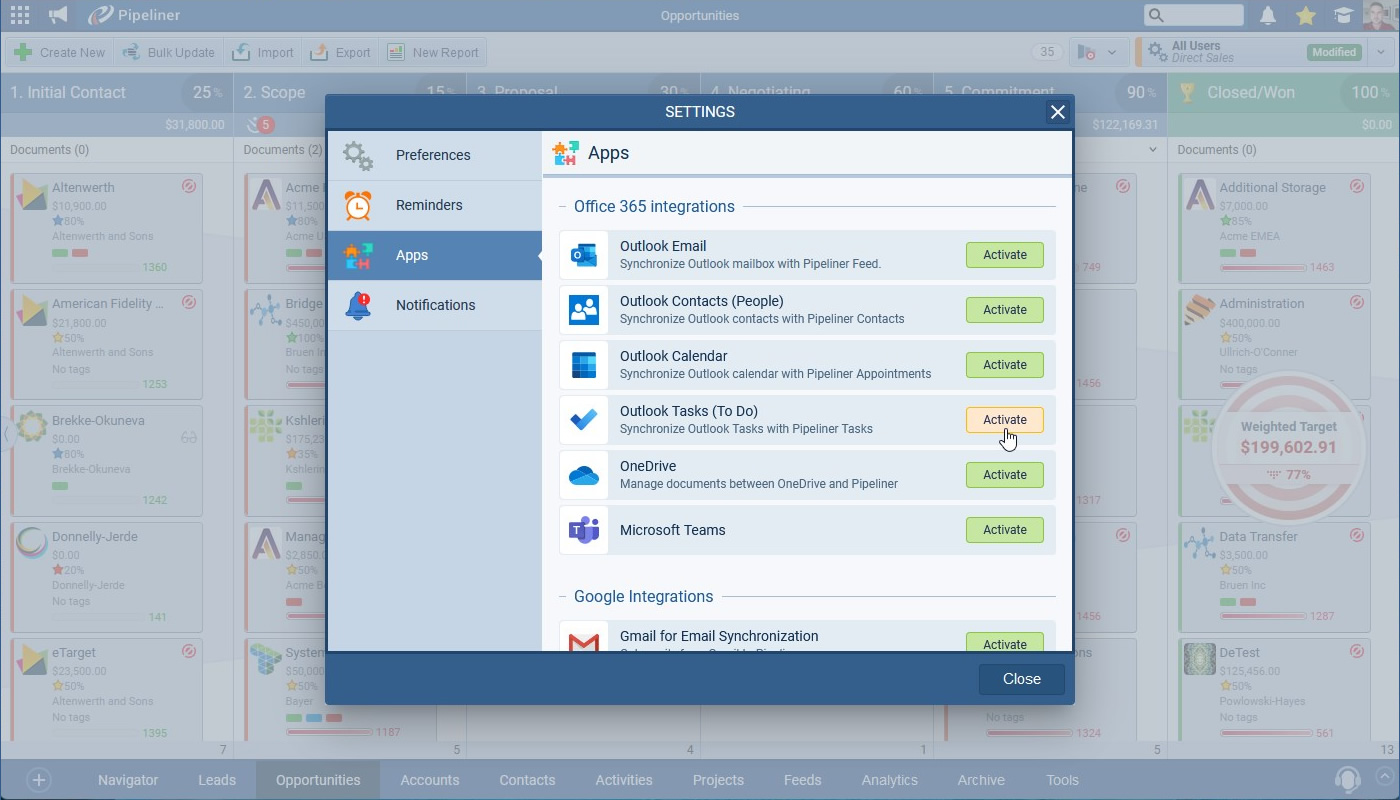
This new Outlook Tasks (To Do) integration is a replacement for the existing Exchange Tasks integration which will soon be switched off unless your organisation is using its own on premise Exchange servers.
Individual users activate from the “Apps” tab under their userUser User means a person who uses or consumes a product or a service, usually a digital device or an online service. Settings. ⤵
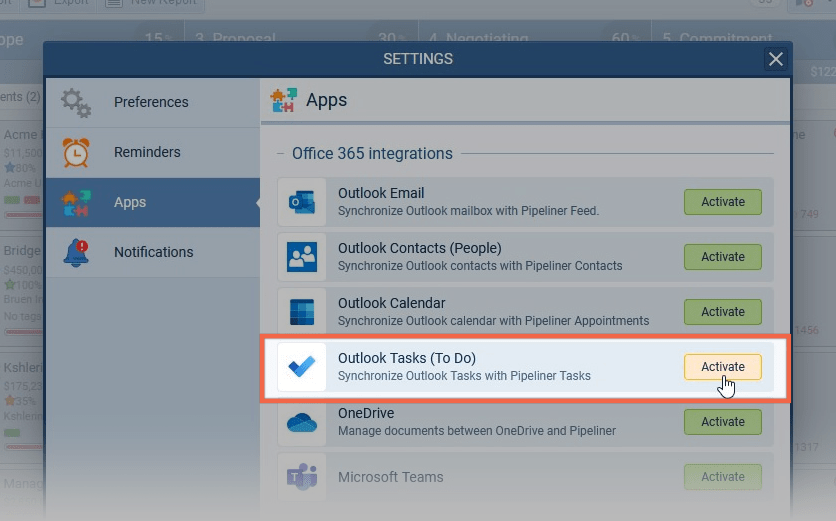
Users can select any folder that exists in the Outlook To-Do or can choose to have the integration create a dedicated folder “Pipeliner” with a pre-defined name. Clicking the “Activate” button will start the integration and run the initial synchronization, after that, changes are synchronized almost instantly. “Subject” and “Due Date” will sync in both directions between Pipeliner and O365 To Do.
Check our Knowledge Base article to get more information about Office 365 Tasks Integration ›
As part of our ongoing usability enhancement program, we’ve updated the following features.
Various Improvements
Multi Select checkbox fields
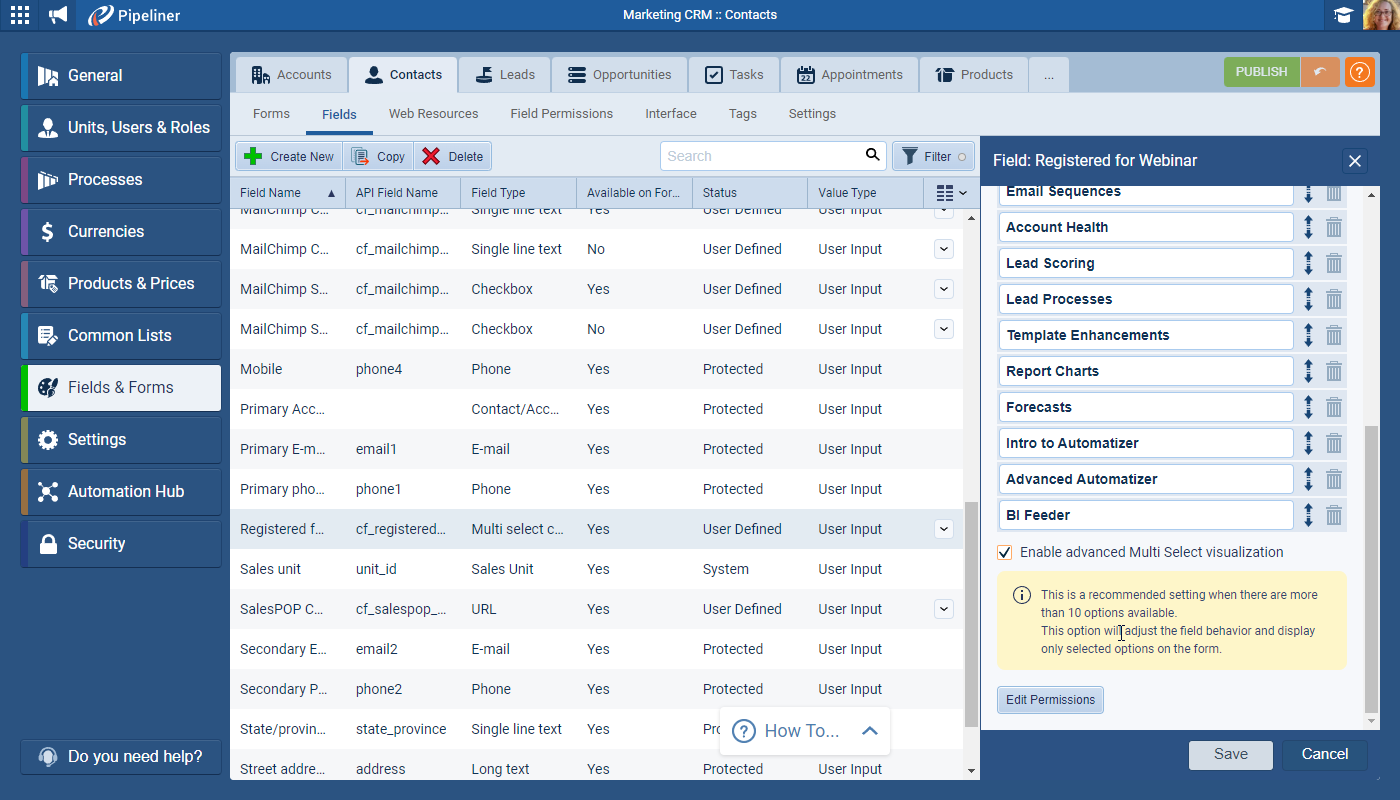
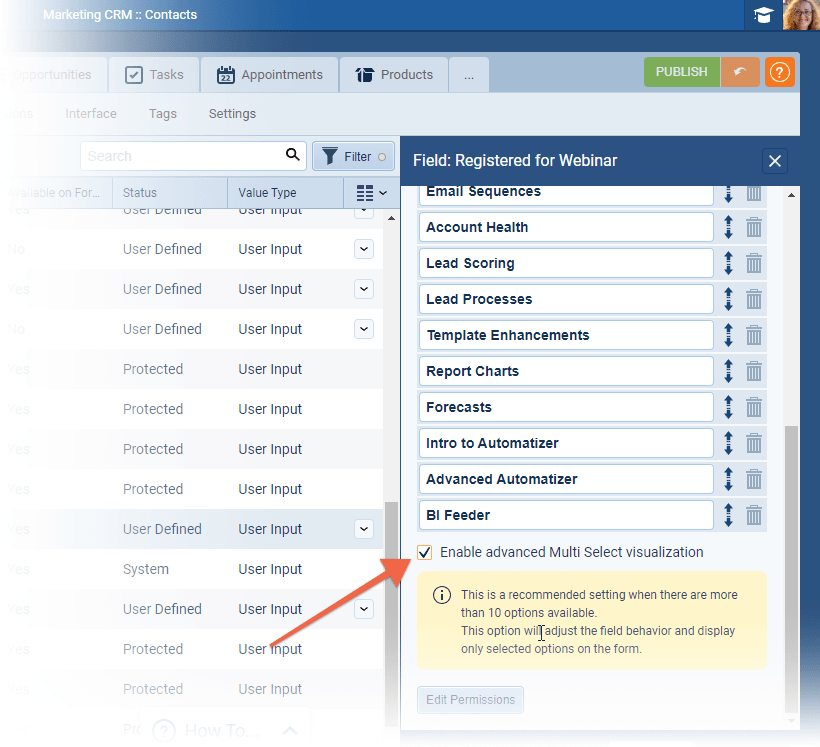
When using Multi Select checkbox fields with long lists (more than 10 options), the field can use up a lot of space on the Form. Now, Admins can “Enable advanced Multi Select visualization” for multi select checkbox fields in the Admin Module in Fields & Forms. ⤵
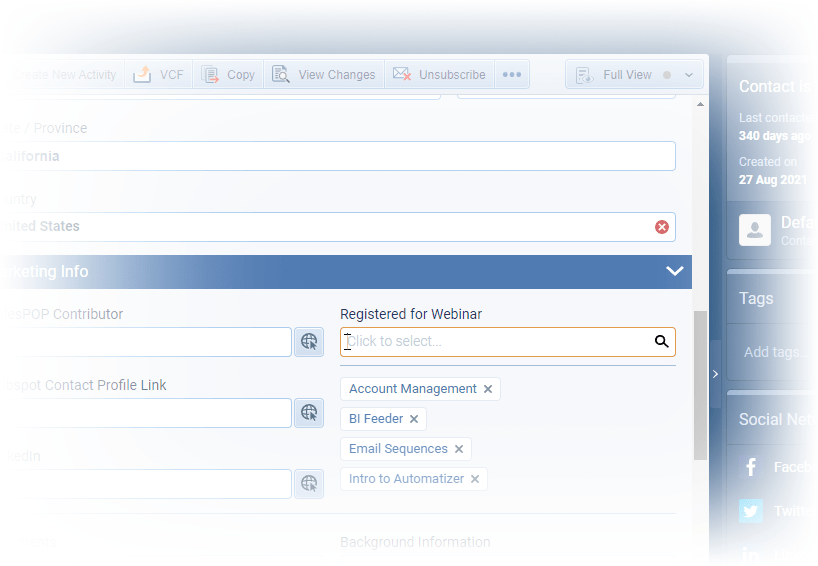
The result of this option is that only selected values display on the Form with additional options available for selection by clicking into the field. If no options are chosen, the field displays as empty with a legend of “no options selected”. ⤵
Reporting Improvements
Dynamic Drill-down titles in charts
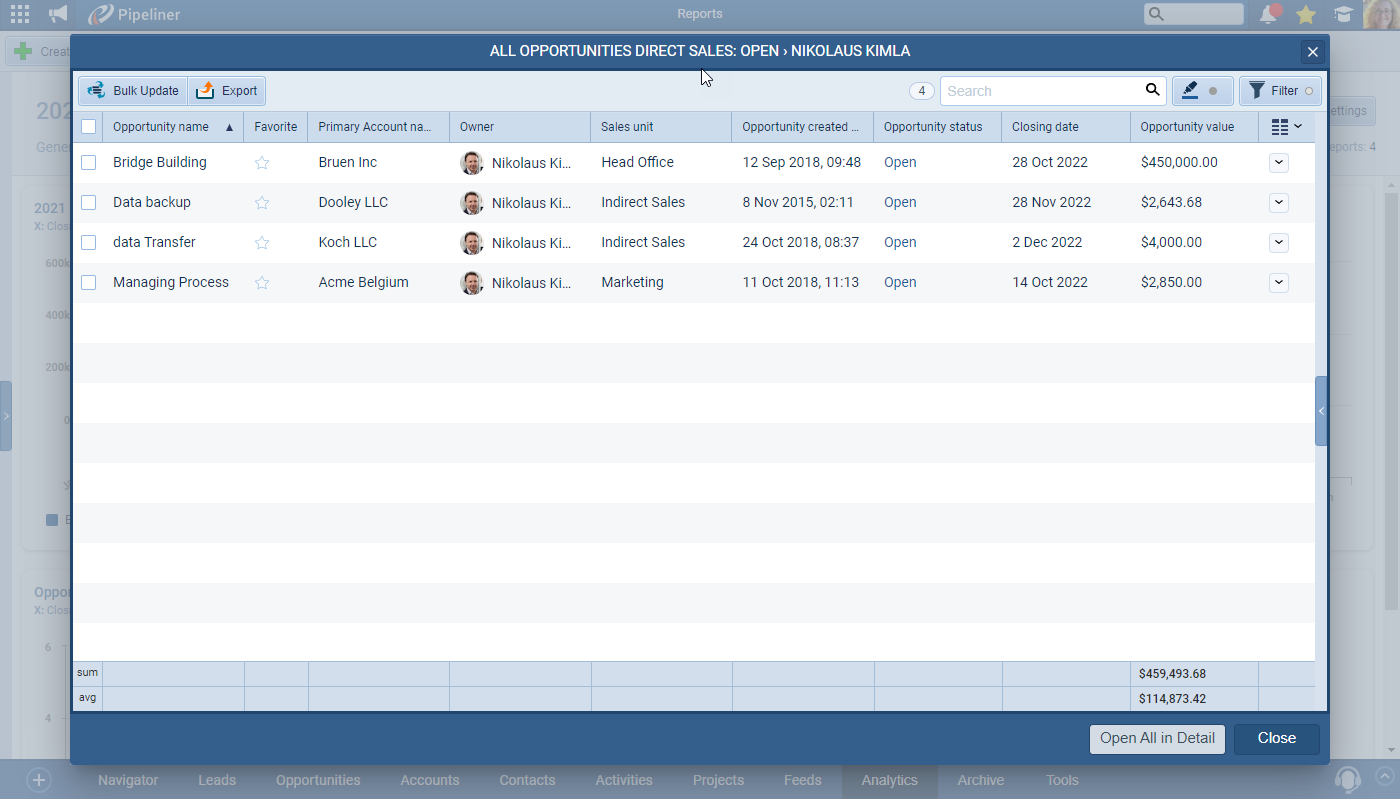
When users drill-down from a chart segment, the window will display the current report name, series and column/segment that the user clicked, so the user always knows which dataData Data is a set of quantitative and qualitative facts that can be used as reference or inputs for computations, analyses, descriptions, predictions, reasoning and planning. they’re looking at. ⤵

Multi-Select & Lookup fields support in charts (Report/Dashboard)
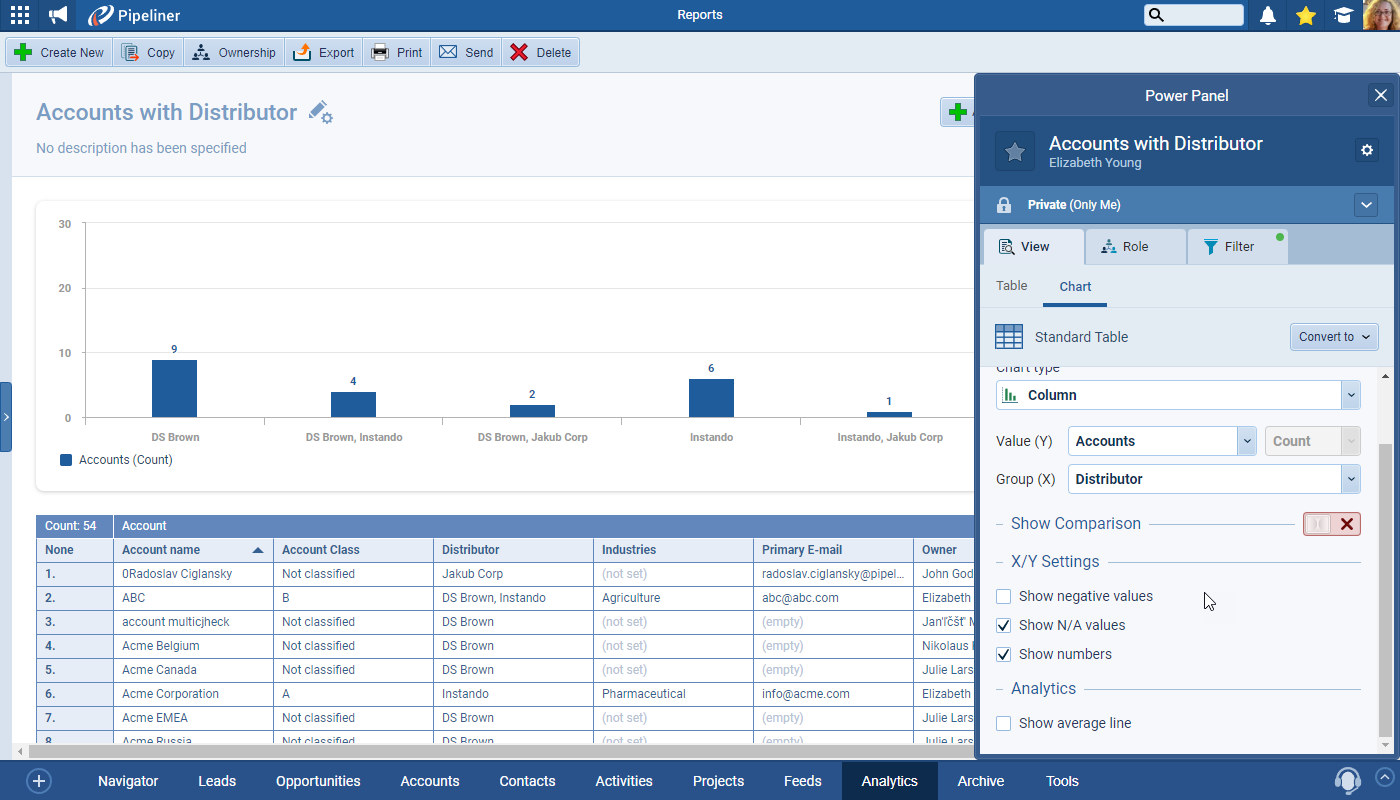
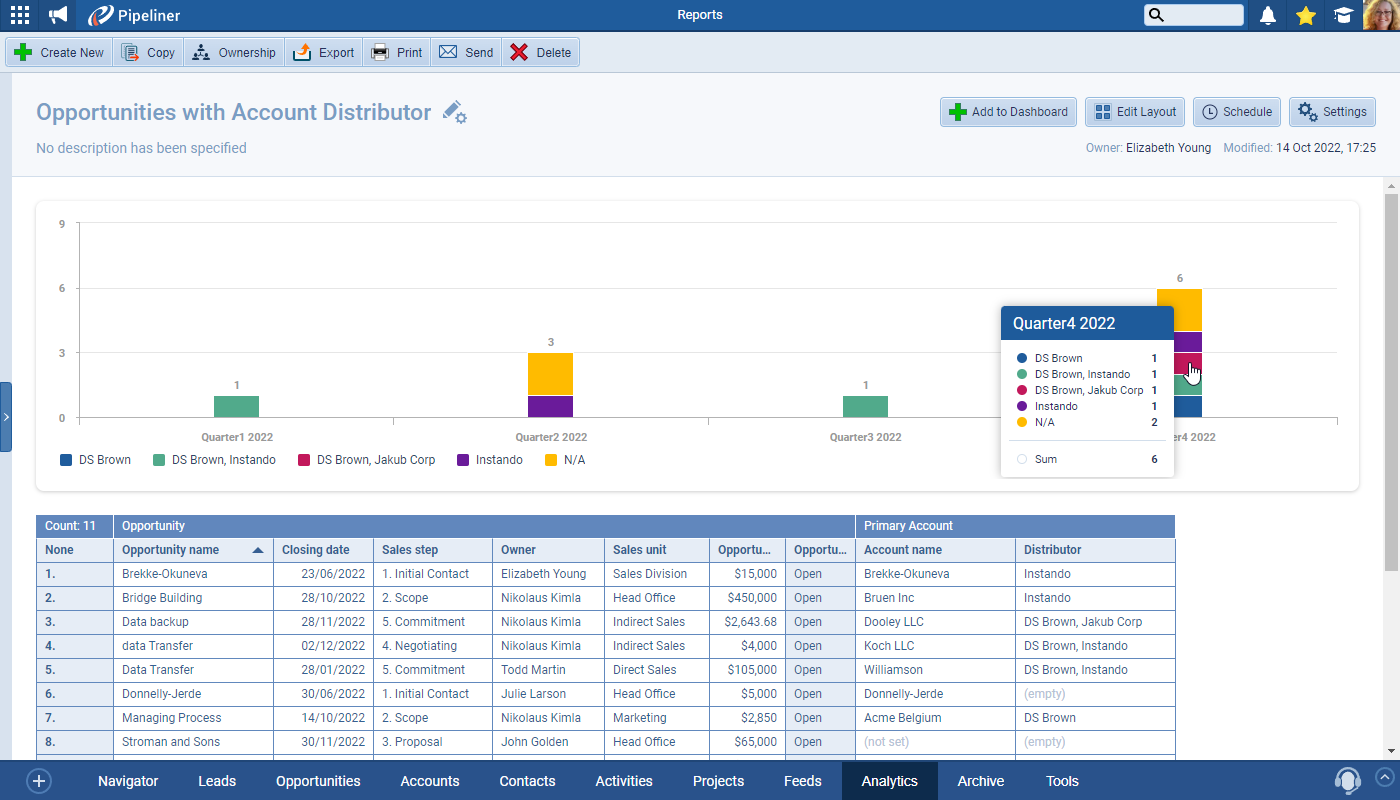
Users can now choose multi-select & lookup fields as a data source in charts. ⤵
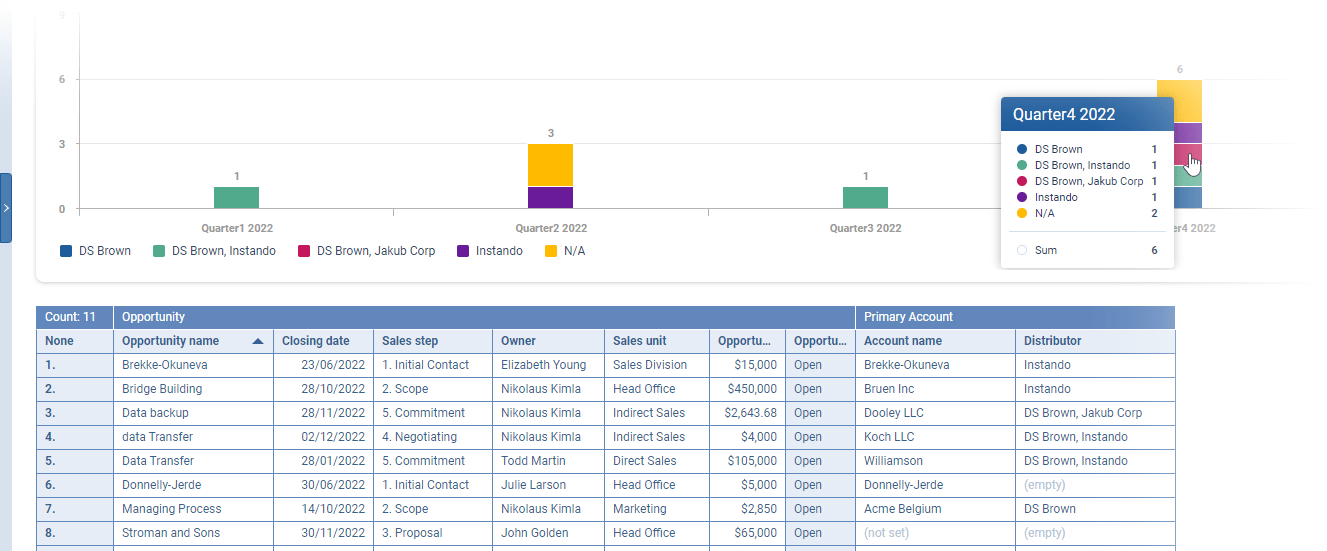
Lookup or multi select fields can be selected in Group (X-axis) and Segment (Y-axis). The chart will only show values that are set (for Lookup fields) or selected (for Multi-select fields) on all available/filtered records.
Chart numbers
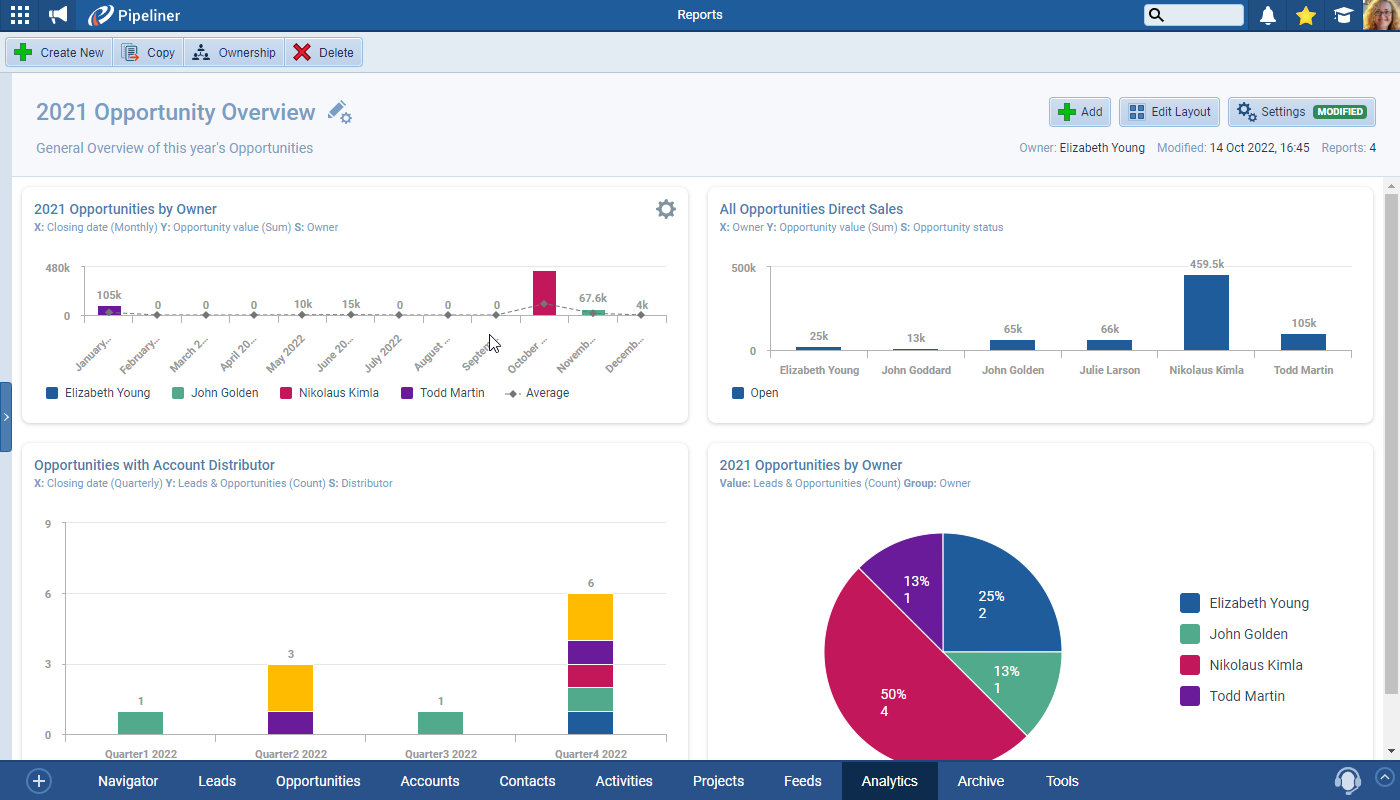
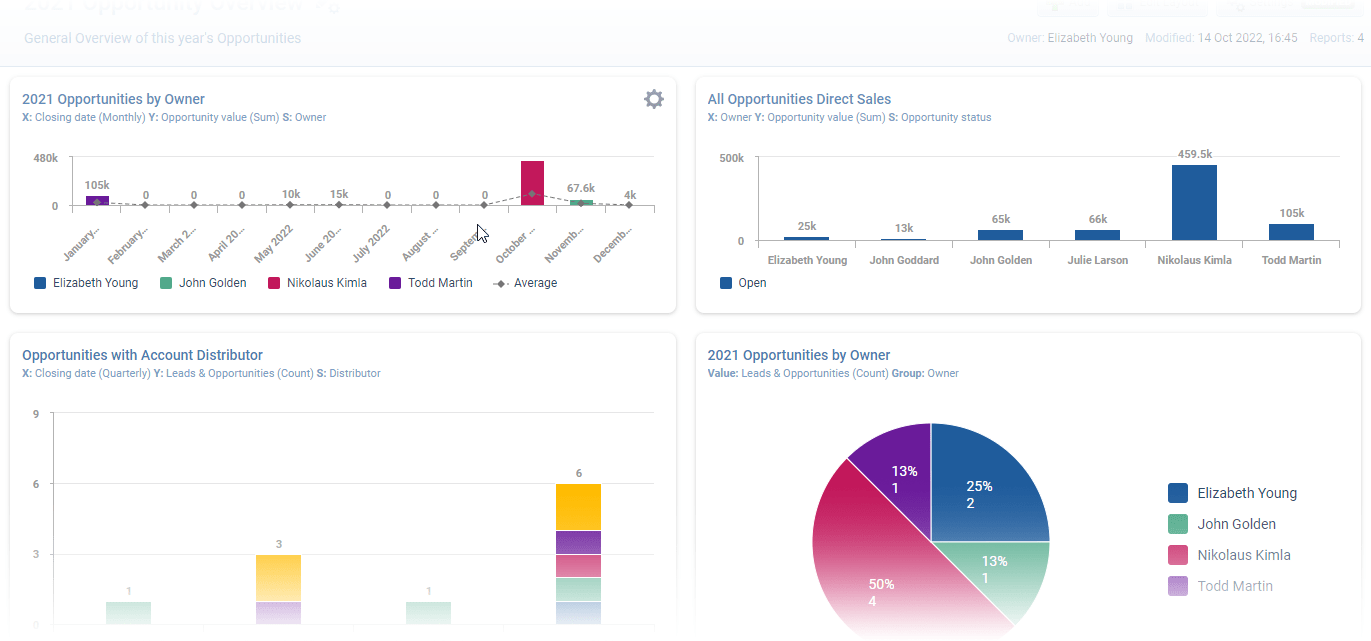
There’s a new option “Show Numbers” in Chart settings which lets users show/hide the aggregate values directly on every column, point or slice in Charts (except for Scorecards). This new option is enabled by default on all charts. ⤵
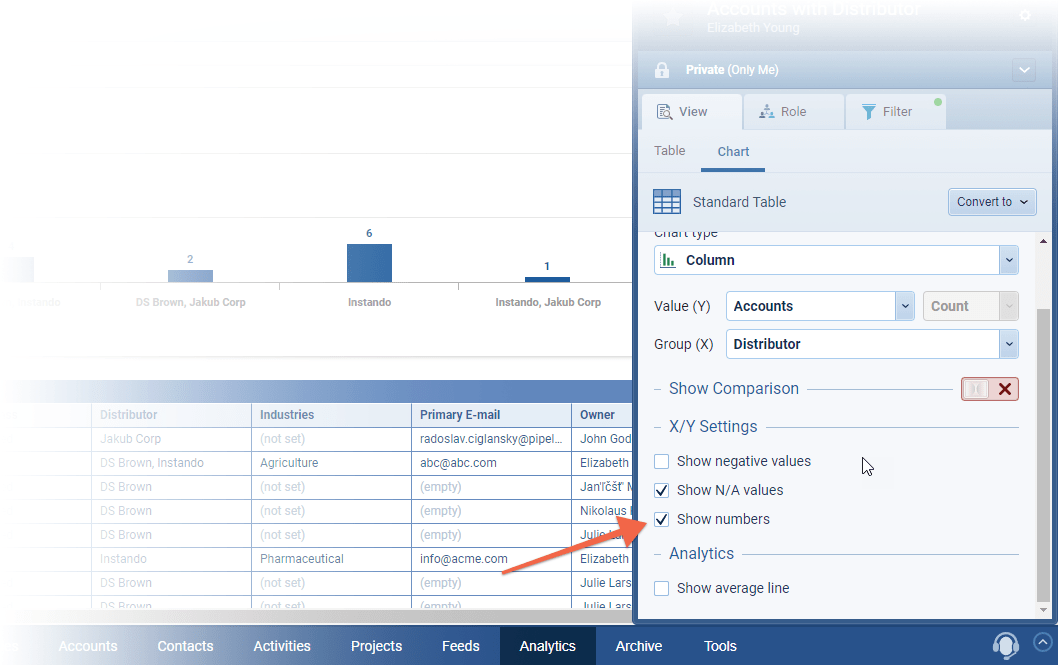
Each chart type will display values slightly differently. ⤵
Hiding Empty Folders
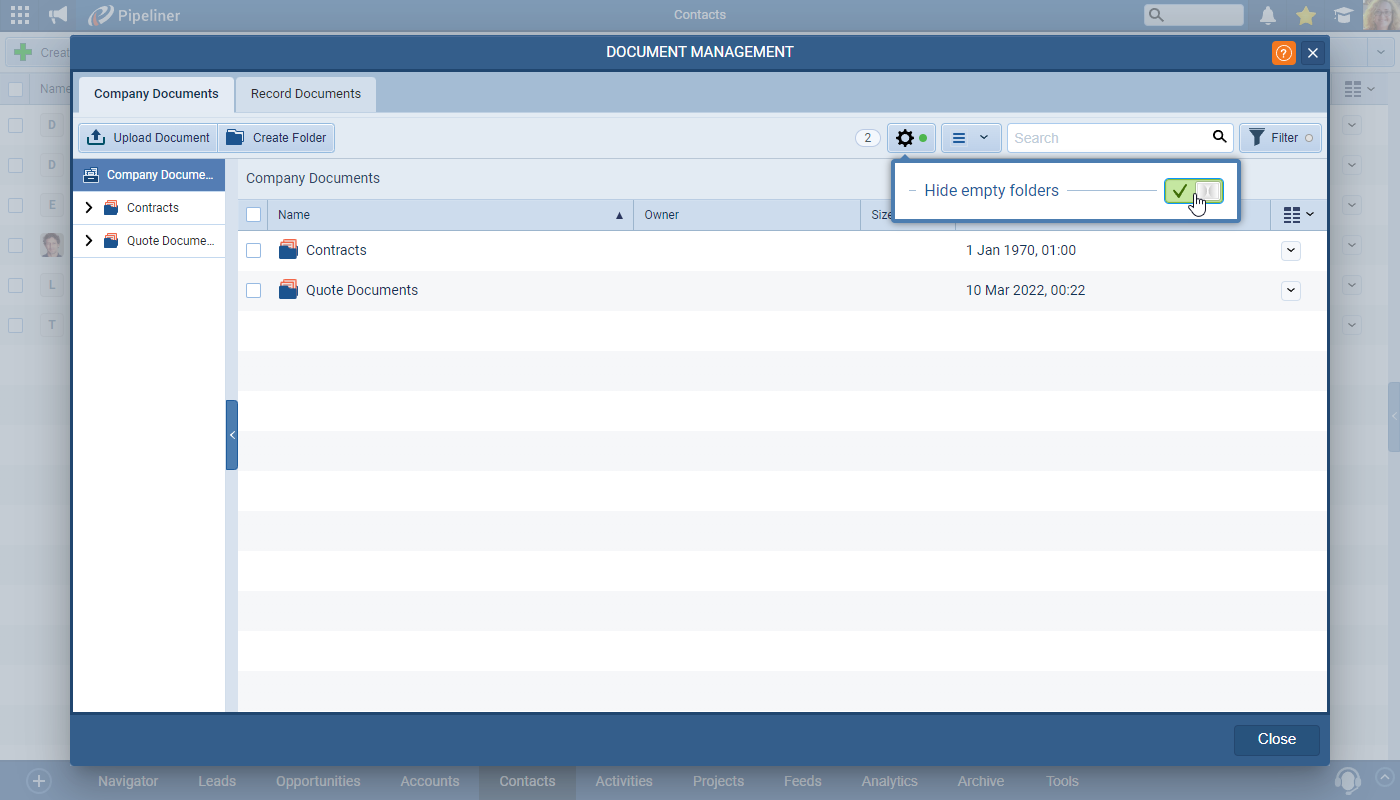
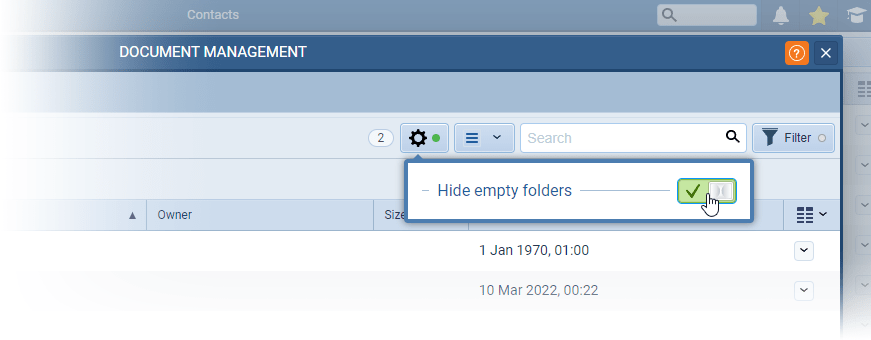
Users can choose to hide/show empty folders in various locations where folders are used:
- Reports
- Document Manager
- Email Templates
- Create Email – Use templates
- Attach Document – Company Documents
This setting is stored on an individual user basis for each location that they select it – it’s not universal for all users or for all locations. ⤵
Gallery of all improvements

Pipeliner CRM is getting better and better with each new release. If you’re curious, about what other releases we had, please visit our “Release Notes” section.
Theory Made Real
Based on proven economic principles, Pipeliner CRM is a tool for everyone. Read more


