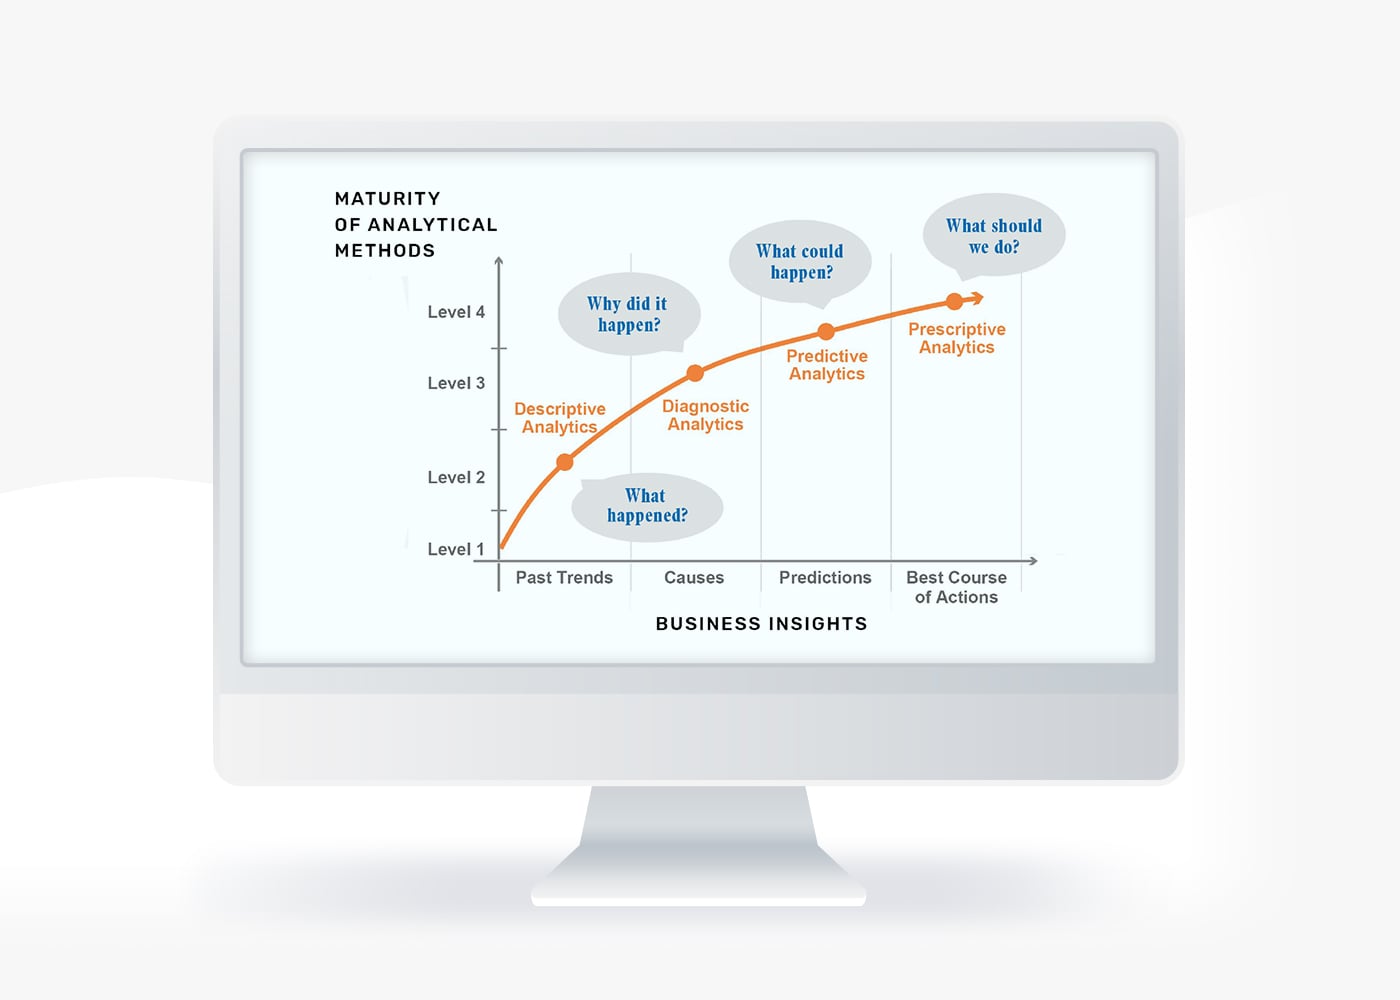
Different Types of AnalyticsAnalytics Analytics is the active study of different types of data with the aim of discovering meaningful patterns and translating these into insight (such as historical analyses and forecasts), or action (such as those intended to improve business performance).
Dynamically brought alive in Pipeliner CRM
DataData Data is a set of quantitative and qualitative facts that can be used as reference or inputs for computations, analyses, descriptions, predictions, reasoning and planning. is the primary driving force in today’s business decisions.
Data alone, though, is no help—it must be analyzed.
There are Four Primary Types of Analytics
Descriptive
Diagnostics
Predictive
Prescriptive
Descriptive Analytics
What Happened?
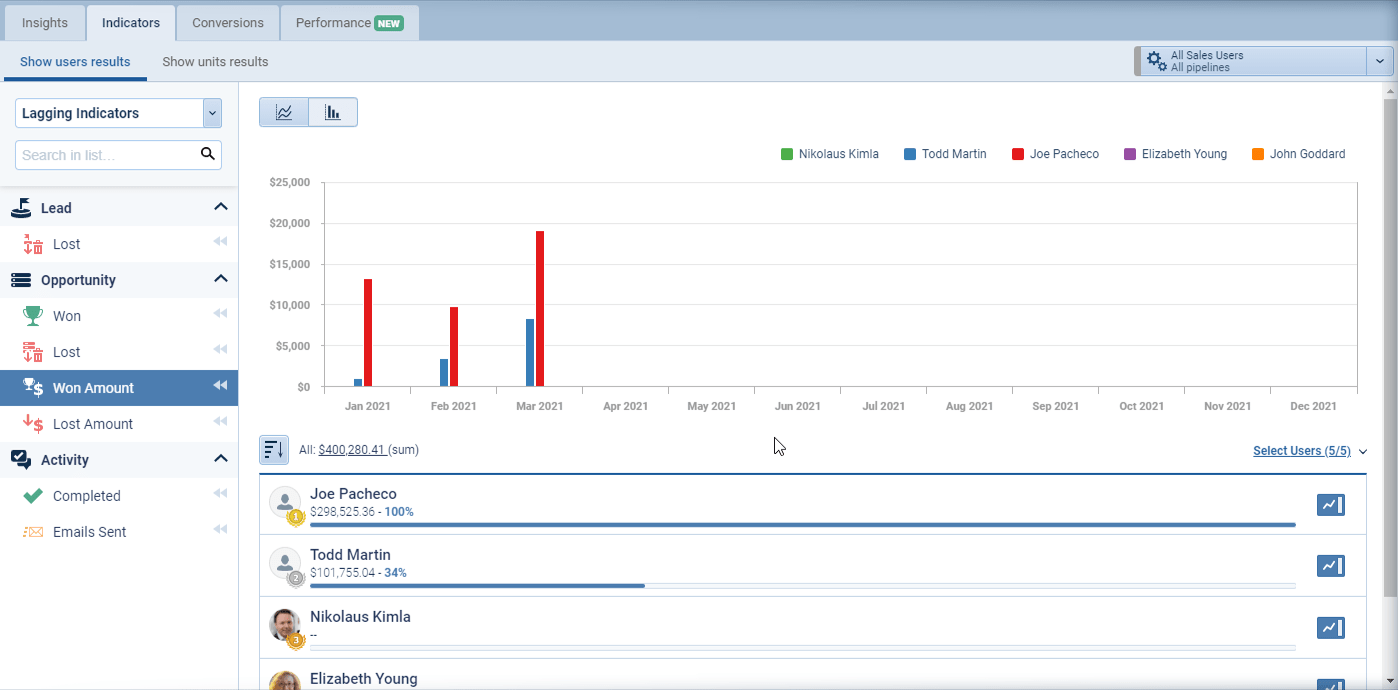
Descriptive analytics tell us all that has gone before.
At Pipeliner CRM, we call these “Lagging Indicators.” Lagging indicators are KPIs that show what has already happened after all is said and done.
Descriptive Analytics Examples
Sales
# of unites sold
Gross marginGross Margin Gross Margin refers to total sales minus the cost of goods sold (COGS). Median for true SaaS cos is 71%, but what are considered to be “good margins” varies in SaaS. If you are running a marketplace/transaction revenue business, be very clear about gross margin. & revenueRevenue Revenue is the amount of money a business generates during a specific period such as a year or a quarter; also called sales.
# of different products sold
Market share
# of deals won or lost
“95 percent of businesses need to manage unstructured data.”
 Forbes
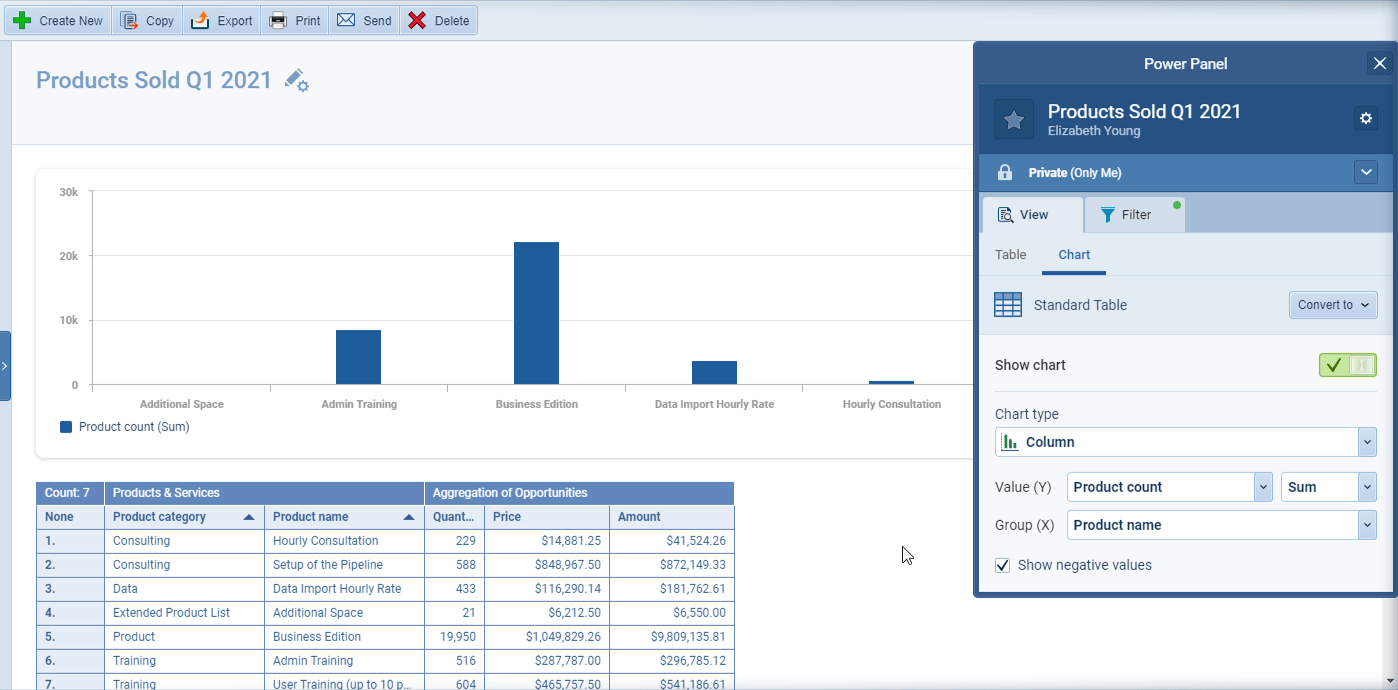
With Pipeliner CRM, we visualize lagging indicators right out of the box—something that no other CRM does today. This is especially true when you utilize the Power Panel to filter all your data and share it, having saved it as a profile.
Diagnostic Analytics
Why Did It Happen?
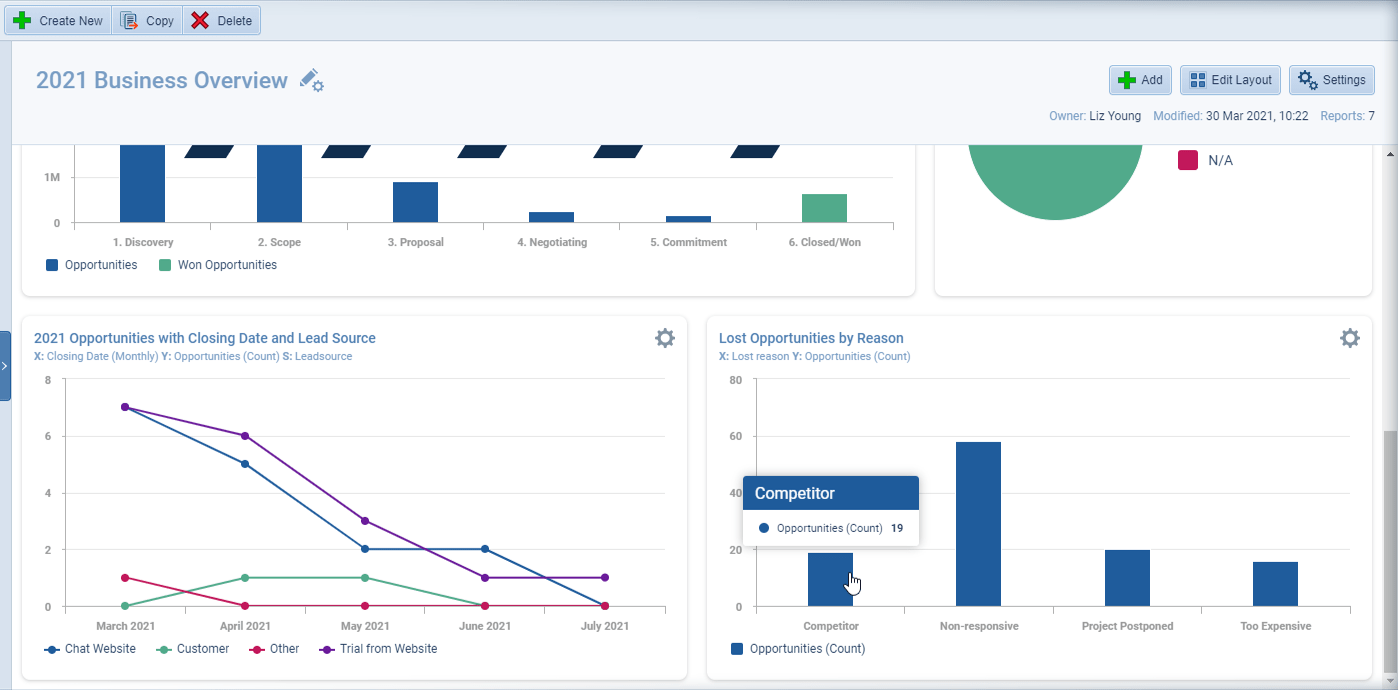
Now that you know what happened, you now need to analyze why it happened. That is done simply by fully analyzing “what happened?” using the lagging indicators.
Once again, use Power Panel filters to isolate the important details in this analysis. For example, you can analyze why some deals have not been closed, or have even been lost.
You can isolate “lost reasons” with a filter and discover how many deals you have lost to your competitors, and learn from this insight so you don’t repeat the same mistakes.
“Data are just summaries of thousands of stories – tell a few of those stories to help make the data meaningful.”
 Chip & Dan Heath, Authors of Switch
Predictive Analytics
What Could Happen?
Once you have analyzed the data, you now have a view of the future in terms of what could happen. What kind of performance is possible?
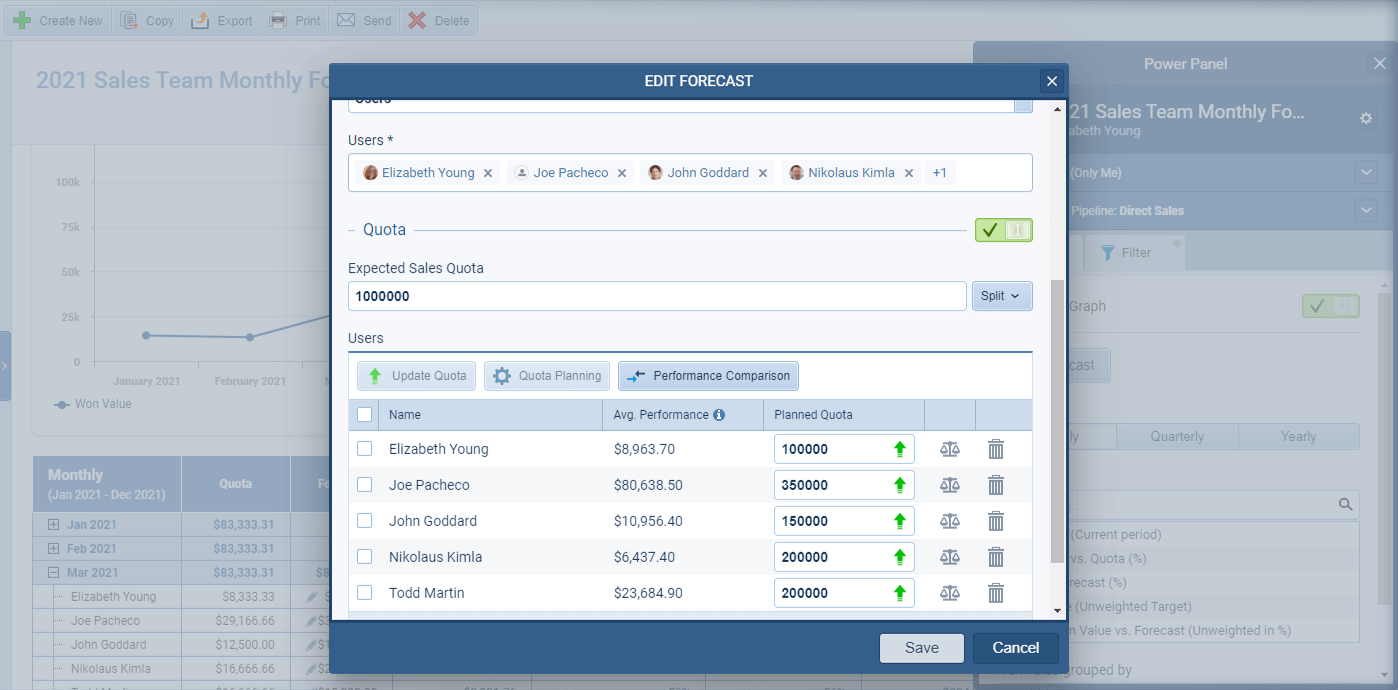
With Pipeliner, we provide powerful forecast reporting. Pipeliner CRM Forecast Reports provides powerful setting of quotas for all team members and then tracking quotaQuota Quota is a predefined benchmark indicating the amount of sales a selling unit such as a sales rep or a regional sales team should achieve within a given period, often used as a measure of success, performance and eligibility for commissions and other rewards. achievement in real-time.
Reports can be shared only with specific team members, or across the whole sales unit, depending on your preferences. Users can then work with that report in Pipeliner.
“Fewer than 20% of sales organizations have forecast accuracy of 75% or greater.”
Quota ForecastingForecasting Forecasting is a prediction or calculation of a trend or event likely to occur in the future based on qualitative, quantitative and historical data as well as emergent but relevant factors.
Pipeliner also provides you with a feature called Forecasting Quota which greatly assists in forecasting and setting of quotas. This feature allows you to compare a salesperson’s quota to the actual forecast, based on working deals already in the system.
“The best way to predict the future is to create it.”
 Peter Drucker, Management Consultant
Prescriptive Analytics
What Should You Do?
Prescriptive analytics provide a clear path forward for sales teams.
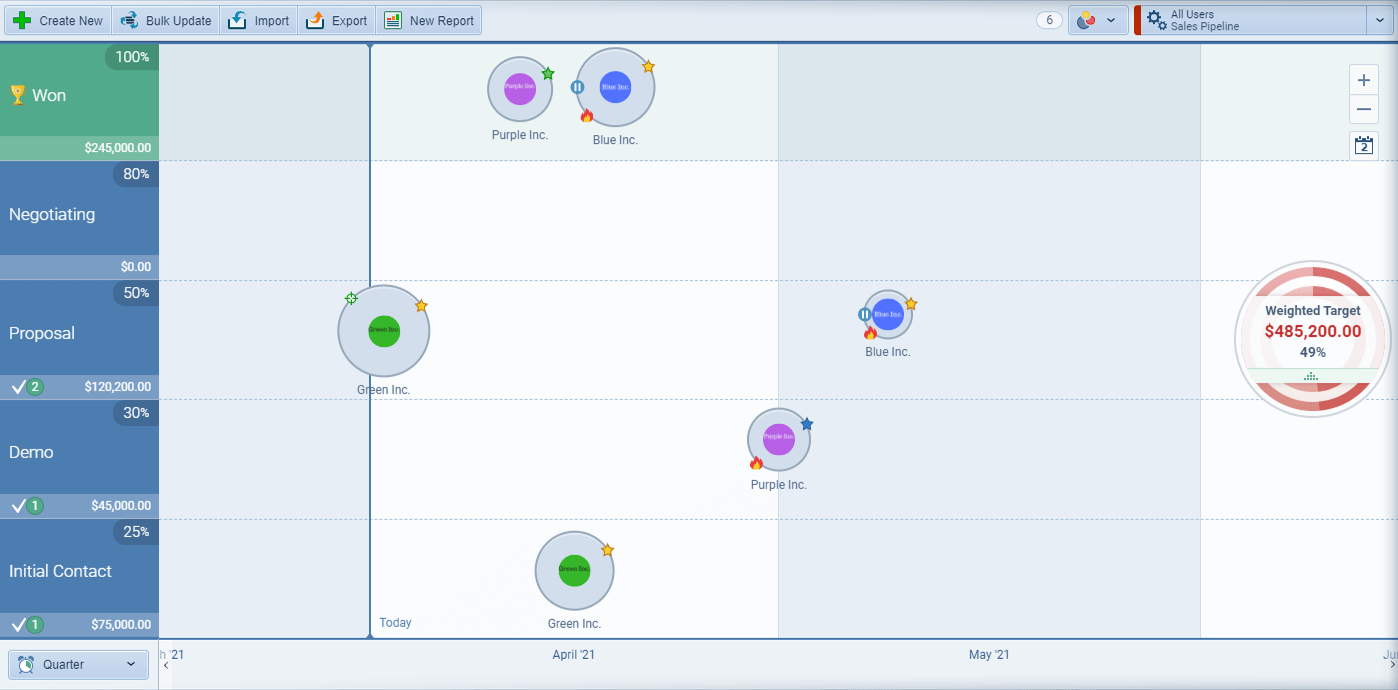
Pipeliner’s primary source of prescriptive indicators, which indicate “What Should You Do?” is our Bubble Chart View. The Bubble Chart View shows a multi-dimensional view of opportunities plotted by sales stage, closing date, and size.
Utilizing Pipeliner’s Power Panel, the userUser User means a person who uses or consumes a product or a service, usually a digital device or an online service. can filter out or in various factors such as:
- deal size
- particular sales reps
- target date
- & many others…
Prescriptive Action Model
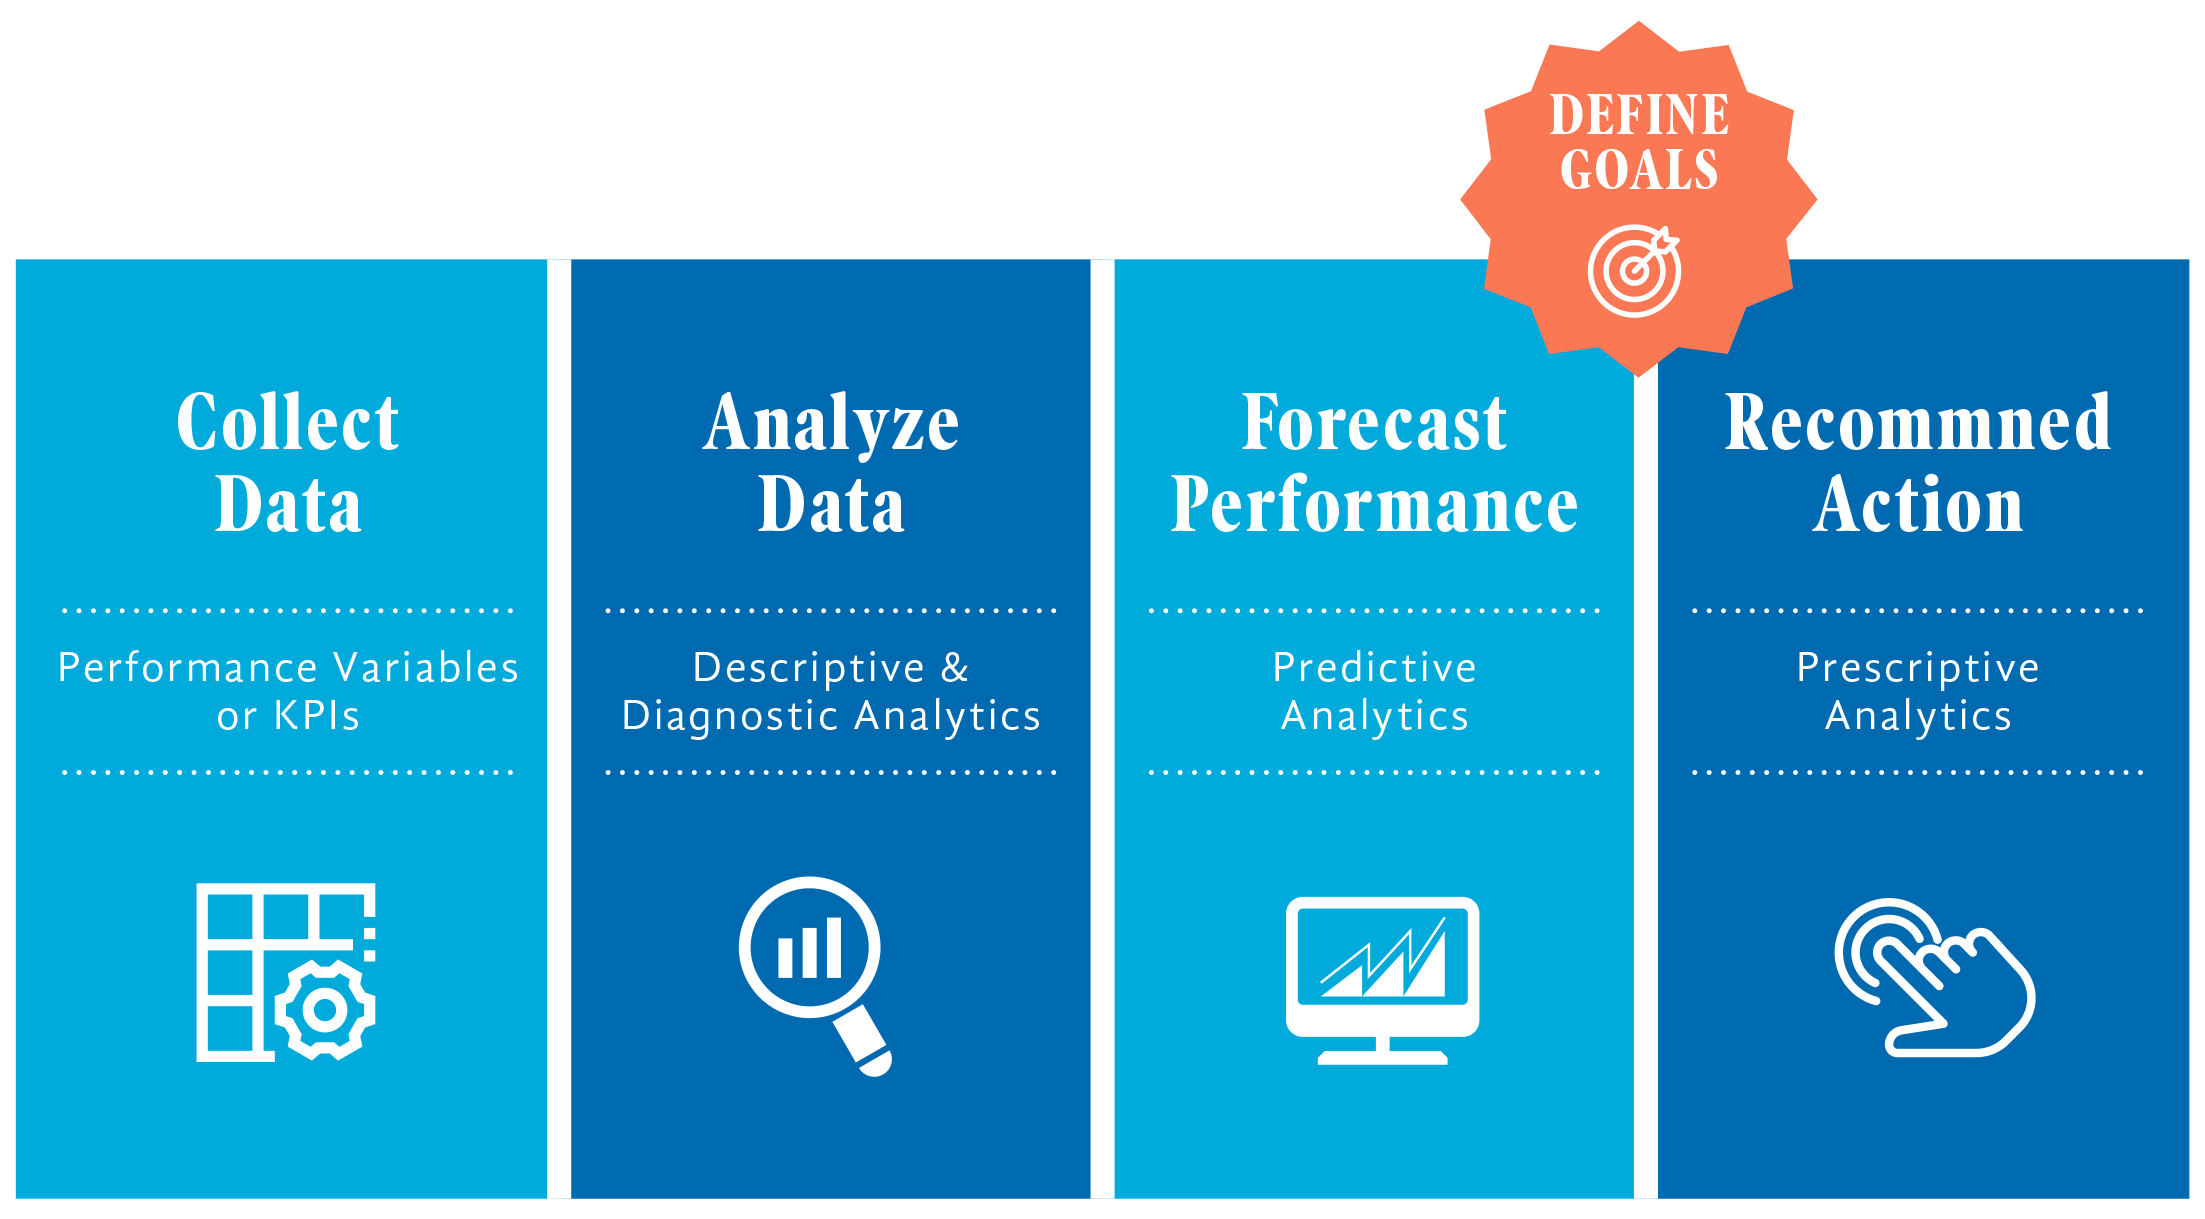
Pipeliner CRM is the first CRM tool that brings the PAM approach alive in a practical, visual manner & takes a sales team through the whole progression of analysis: descriptive, predictive, prescriptive, diagnostic.
Prescriptive Action Model (PAM)
- Data is collected and then analyzed
- Performance is then forecast
- Action is recommended
In the end, when analysis has been done and forecasts have been made, you need positive recommendations of actions you’re going to take. Recommended actions in sales are all about setting correct goals and creating action plans for reps.
As part of PAM, you can also extract recommendations for training and training strategies. These can be used to assist salespeople in overcoming their weaknesses.
“The problem with the traditional “enforced” CRM is that users dislike using it. This affects the data being input—it can be input incorrectly, or left out, or neglected. With Pipeliner CRM, users enjoy using it because it truly benefits them. Because they enjoy using it, because they like it, the data being entered tends to be far more accurate.”
 Nikolaus Kimla, Founder & CEO, Pipeliner CRM
