Performance Feature
Part of our new Insight feature set.
Process Performance
A company could have one or more sales processes and needs instant insight into what is happening with these processes. What does that mean? It means finding out how many leads or opportunities you are creating.
It’s about what you lose, what you win, your win rate, and the average velocity for opportunities.
“Aberdeen Research has found that high-performing sales organizations are 38% more likely to leverage sales analyticsAnalytics Analytics is the active study of different types of data with the aim of discovering meaningful patterns and translating these into insight (such as historical analyses and forecasts), or action (such as those intended to improve business performance). tools.“
Performance Feature Detail
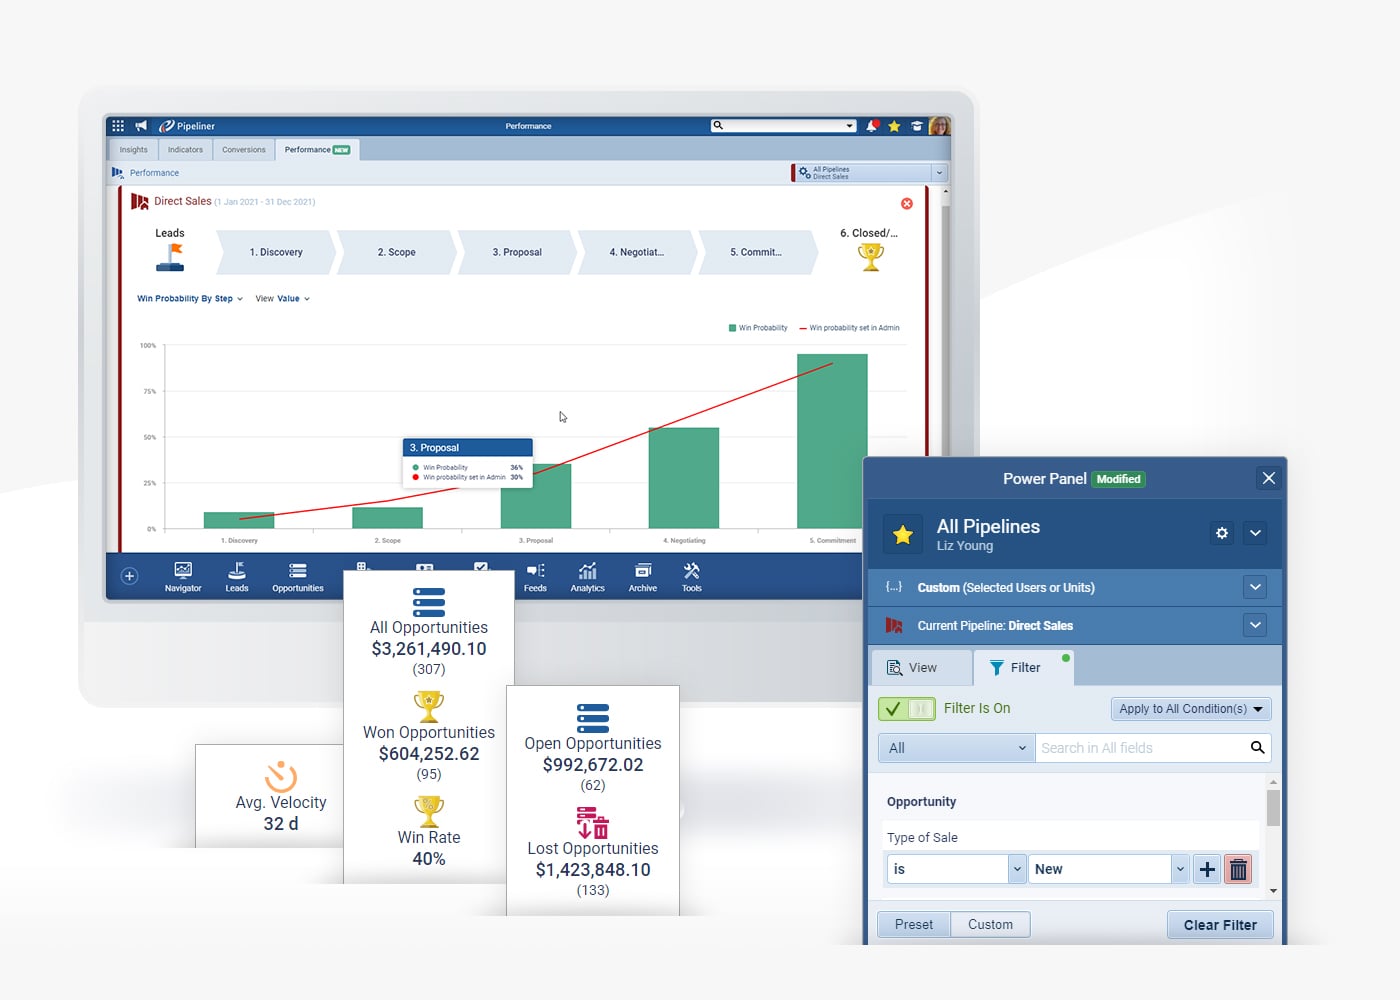
Reviewing a Process
Mouse over stages of a process
View KPIs for each stage
View a bar graph for each stage
Review conversions per stage
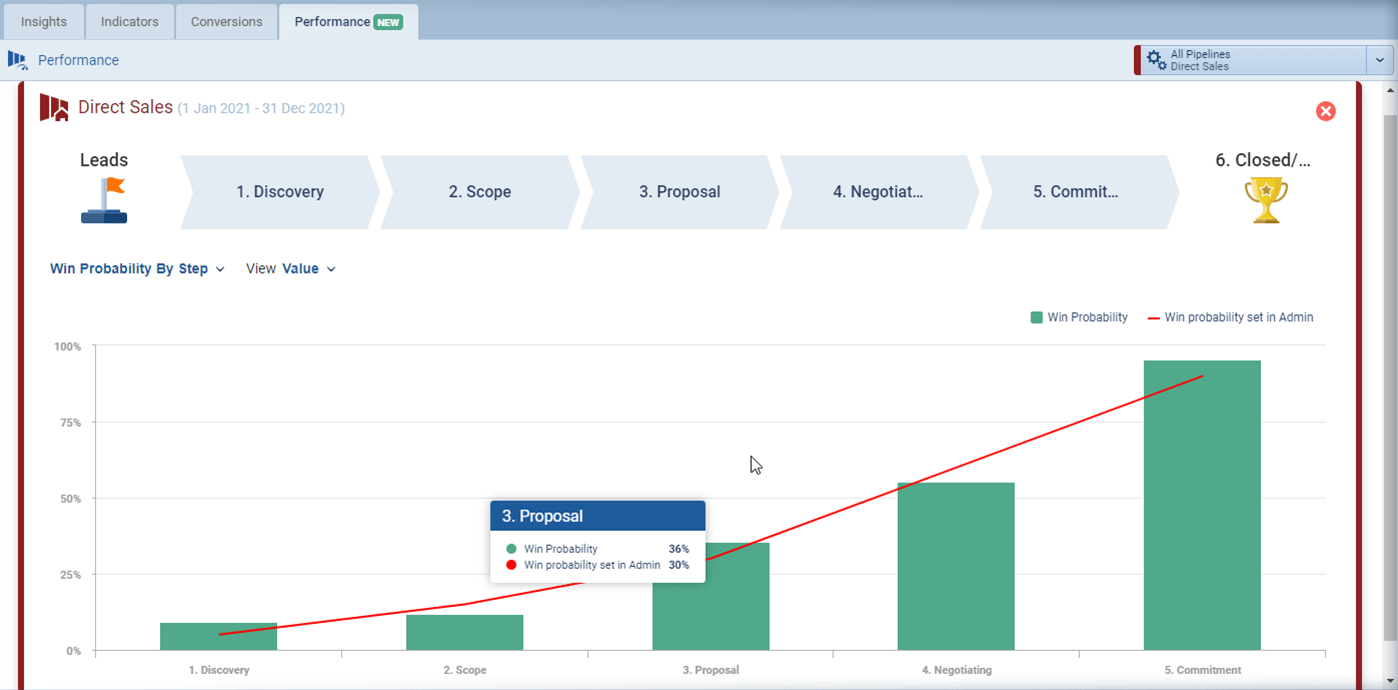
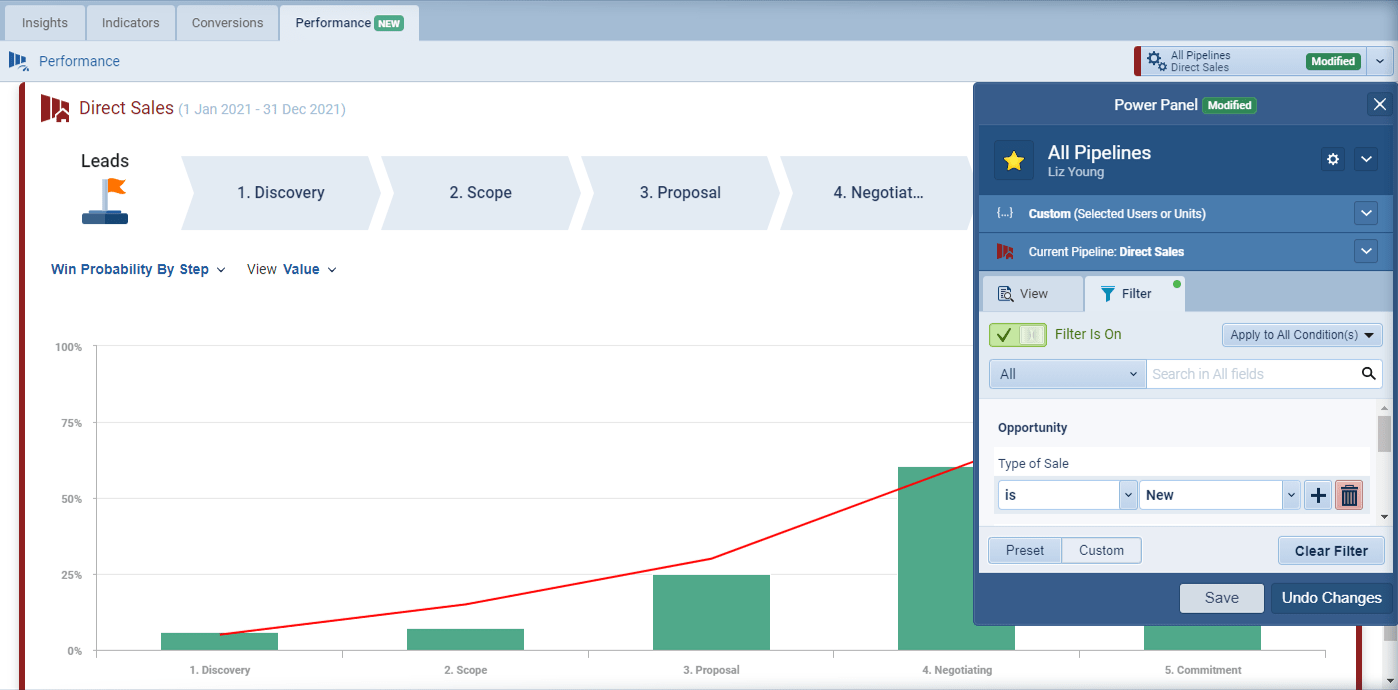
Review Win Probability
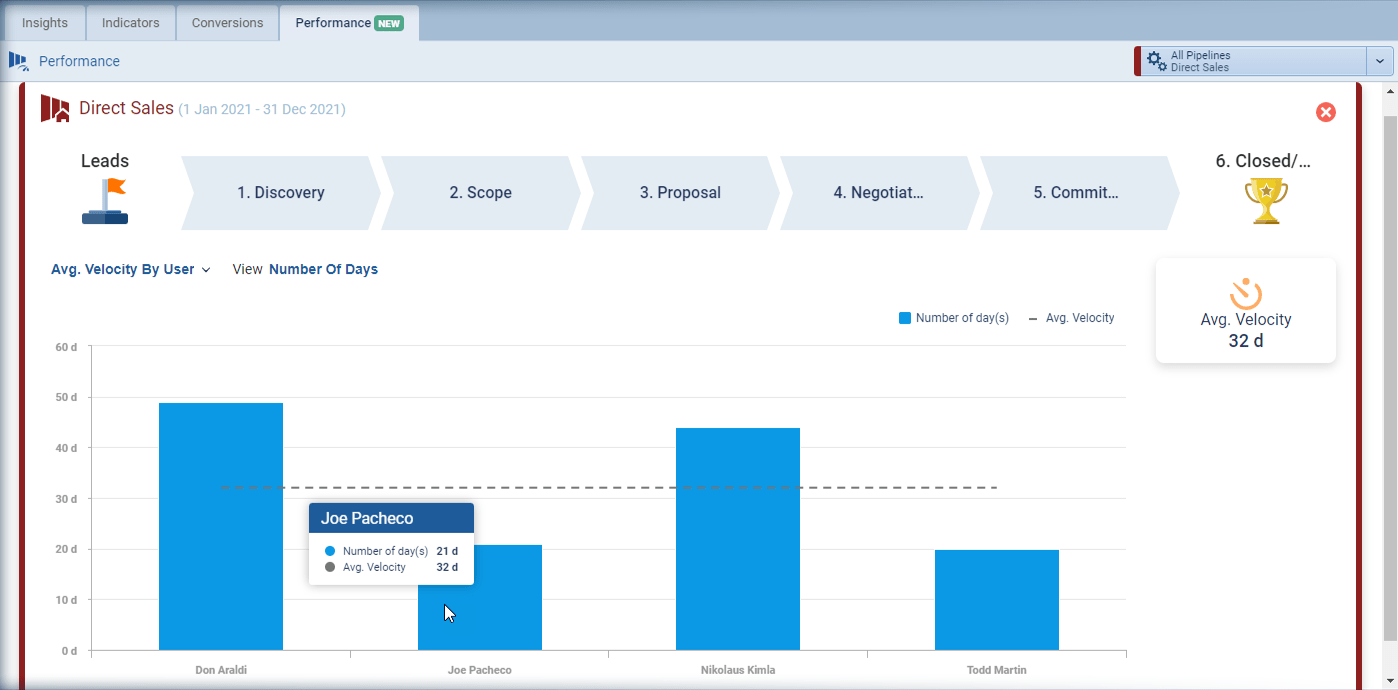
Review pipelinePipeline Sales pipelineis a visual representation of the stage prospects are in the sales process. Velocity
“With Pipeliner’s visualizations, we have always been very deliberate about our choice of icons. With our icons, we’re giving you a clear overview of the dataData Data is a set of quantitative and qualitative facts that can be used as reference or inputs for computations, analyses, descriptions, predictions, reasoning and planning., for leads, opportunities, and everything else.”
 Nikolaus Kimla, Founder & CEO, Pipelinersales Corp.
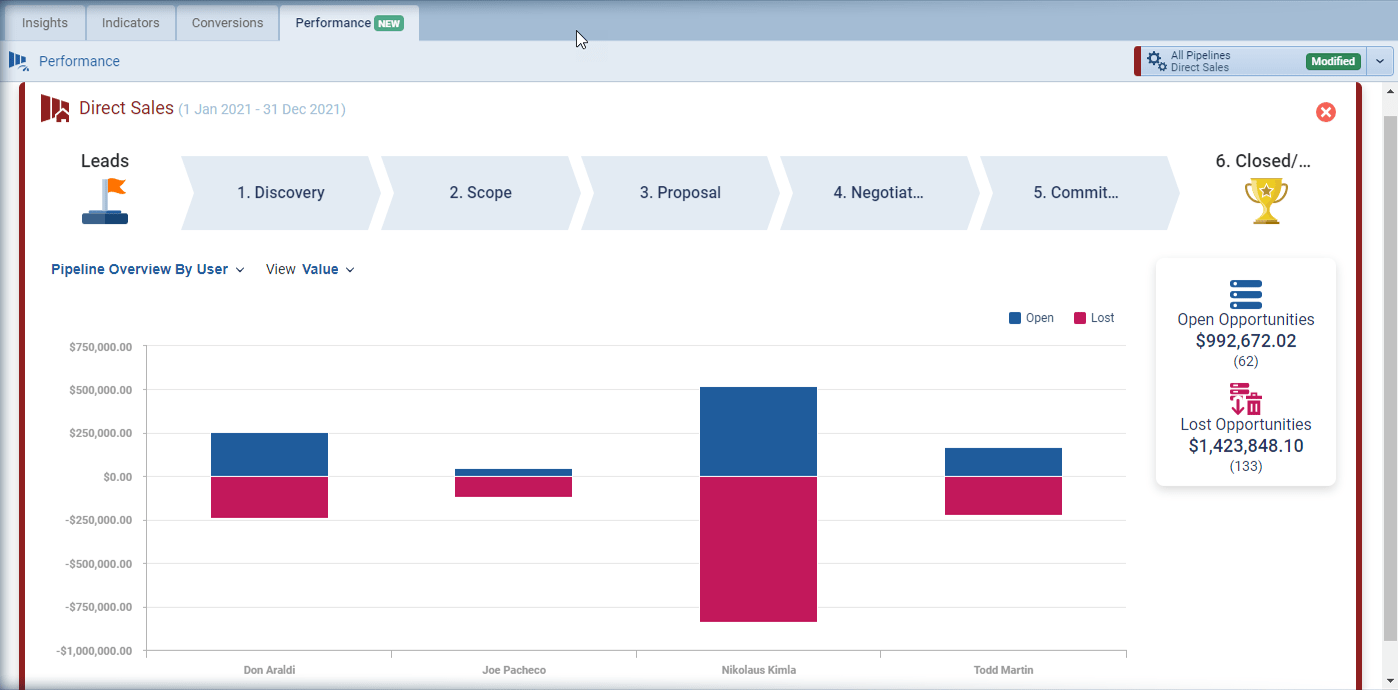
Reviewing People Performance
View conversionConversion Conversion is the process of turning a target consumer into a paying customer; or more generally, the point at which a user performs a specific action favorable to a marketer or a seller. rates by individual or teams
See how quickly they move through sales stages
Review conversions & win rates
Easily see who is performing better
Also, you can view all of these metricsMetrics Metrics are quantities that are measured and used to: from a company-wide perspective too
“I can’t ever remember being struck by lightning when making a big decision. It’s always about taking in more and more data points.”
 Michael Dell
Unique Perspective
Pipeliner is the first CRM company to provide a complete performance overview, with leading and lagging indicators, insights, and performance.
When you view these through the Power Panel, you can view by:
- Sales Unit
- ProductProduct Product refers to anything (an idea, item, service, process or information) that meets a need or a desire and is offered to a market, usually but not always at a price. Lines
- Type of Sales
- New Business
- Upsell Business,
- Upgrades
- Renewal Business
- & many other parameters…
With the Power Panel, you can filter such items in one second.
OptimizationOptimization Optimization is the process or act of altering a system, design, or procedure such that it 1) attains full functionality or efficiency, or 2) generates maximum output, benefit, or impact.
Your team can only improve if you’re able to isolate their weaknesses so that you know where to work to optimize the process.
Efficiency results in productivity, especially when you clearly understand your weakest points so they can be improved.
When you’re able to strengthen each step to make it more efficient, your productivity increases.
“According to the Harvard Business Review there is an 18% difference in revenueRevenue Revenue is the amount of money a business generates during a specific period such as a year or a quarter; also called sales. growth between companies that defined a formal sales processSales Process Sales Process is a series of strategic steps or a set of activities aimed at driving sales growth through the alignment of personnel, market insight, methodologies, relevant business units, and technology. and companies that didn’t.”
