Real Sales Performance Management
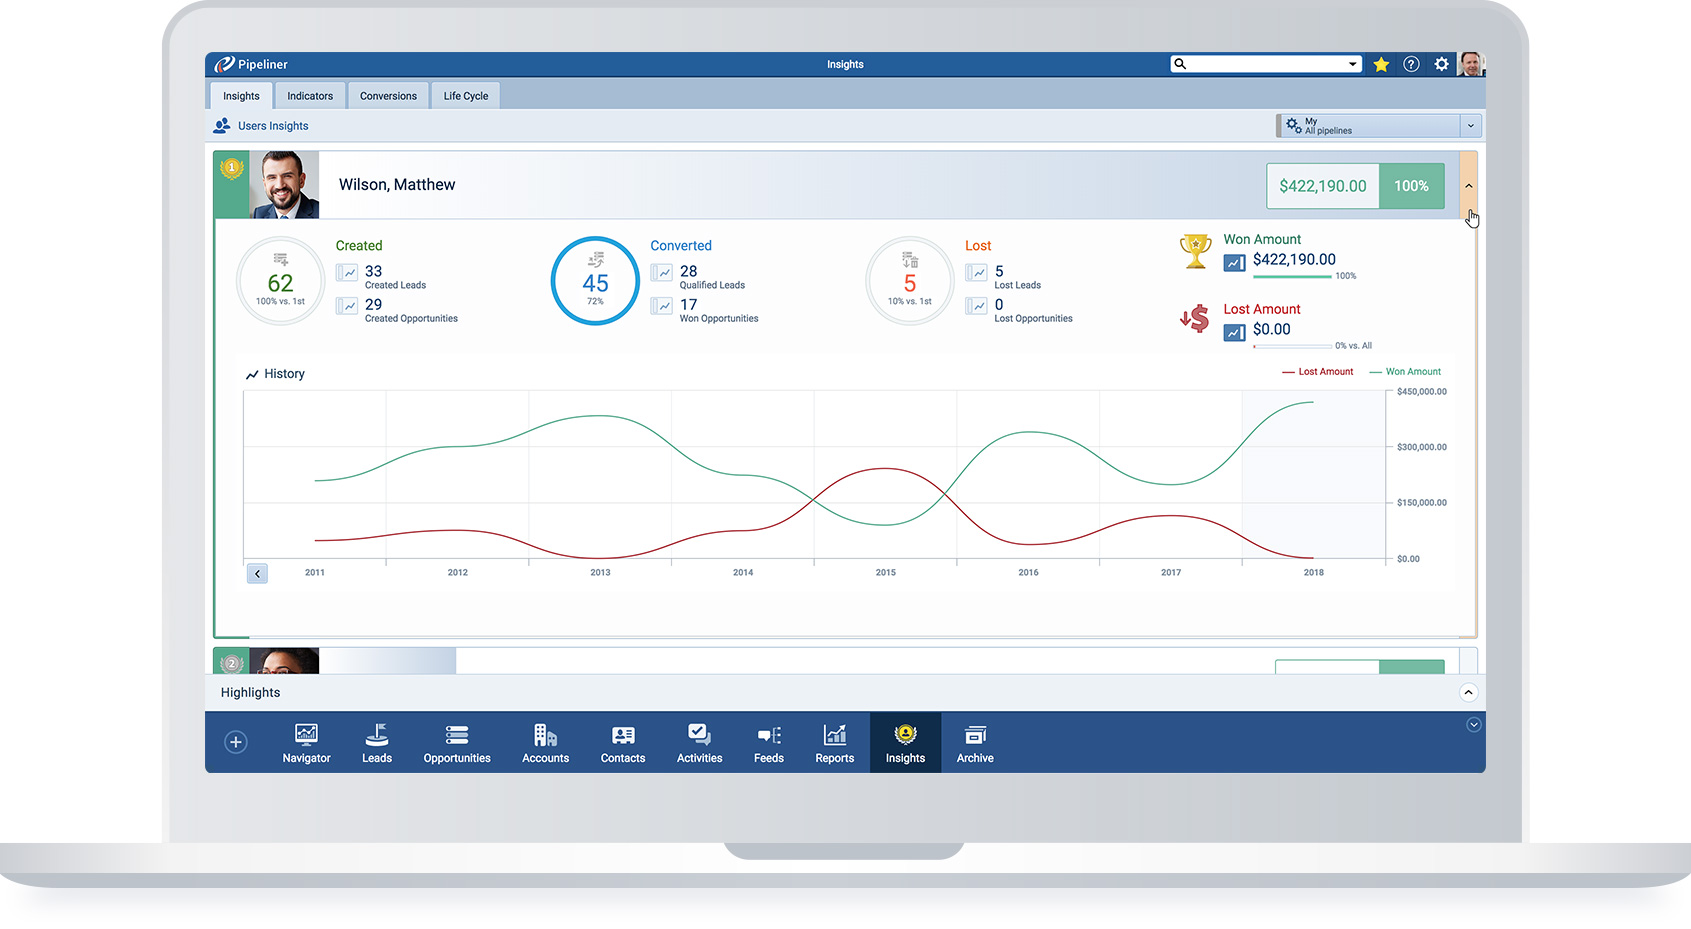
With its breakthrough Sales Performance Insights feature, Pipeliner brings its powerful visual, intuitive functionality to sales performance management.
Satisfying a Crucial Need
Since the beginning, efficient sales performance management has been a primary purpose of CRM. Likewise, individual team members have desired the ability to evaluate their own performance.
Unfortunately, such functionality in traditional CRM solutions has proven overly complex and unwieldy. It failed to provide a clear, rapid view into overall sales team or individual sales rep performance, or comparisons among team members.
As with many aspects of CRM, Pipeliner has greatly simplified and yet made far more powerful this aspect of sales management.
The Difference
Now, instead of spending hours searching all over through spreadsheets or through various aspects of a traditional CRM solutionSolution Solution is a combination of ideas, strategies, processes, technologies and services that effectively helps an organization achieve its goals or hurdle its challenges., just to perform an analysis of rep or team performance, it’s as simple as a few mouse clicks into Pipeliner’s Performance Insights feature. Discover how reps or teams compare to one another, who is doing well and who perhaps needs coaching or mentoring.
Performance Insight Instant Views
Teams
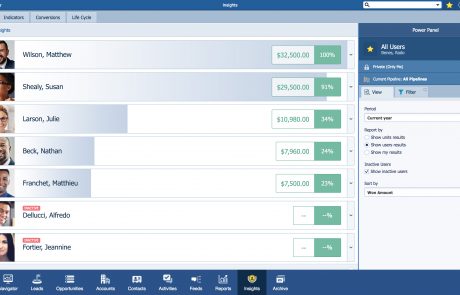
When leading a sales team, gaining insights into sales performance is a snap:
- A selection of pre-defined Key Performance Indicators (KPIs) is available for use
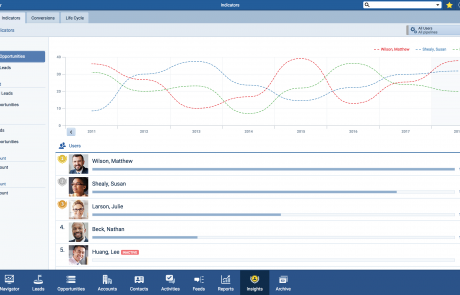
- Zero in: Utilize “Click-to-Detail” functionality to focus in on a specific userUser User means a person who uses or consumes a product or a service, usually a digital device or an online service. and related KPIs
- Toggle between user view (to compare users) and sales unit view (to compare sales units, teams or territories)
- View the historical trend of a team
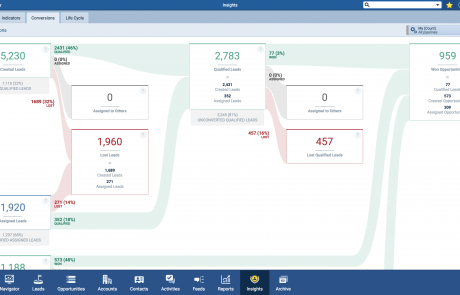
- Click on the Conversions tab to see conversions of leads and opportunities, per rep
Individuals
Performance insights is equally as valuable to the individual user:
- Select one or more pre-defined KPIs
- View “overview” stats for the individual, such as closed deals, revenueRevenue Revenue is the amount of money a business generates during a specific period such as a year or a quarter; also called sales., or created leads
- View the historical trend of a user
- Click on the Conversions tab to see conversions of leads and opportunities

Collaborative Conversions
Collaborative Conversions maps all the dataData Data is a set of quantitative and qualitative facts that can be used as reference or inputs for computations, analyses, descriptions, predictions, reasoning and planning. for all the users involved within the sales processSales Process Sales Process is a series of strategic steps or a set of activities aimed at driving sales growth through the alignment of personnel, market insight, methodologies, relevant business units, and technology. including BDRs, SDRs and Salespeople. Within a collaborative environment, in which more people are involved in a single opportunity, you will get a visual overview of success rates.
Life Cycle
The Life Cycle feature allows you to gain an insight on the time (days) your team members require to close an opportunity. It tracks the time leads and opportunities remained in the system, by user or unit.
Comparison Chart
The Performance Insights Comparison Chart compares open, won and lost opportunities, all within the same graphic.
Power Panel
Through the Web Insights Power Panel, Pipeliner CRM’s powerful filter functionality can be applied to Insights. You can filter out or in your own statistics, or (if allowed) those of your team.
Drill Down
For any Performance Insights score, you can drill down to see exactly which variables and values are included.
Some Other Highlights:
Dynamic Target Feature keeps a constant visual check on your target progress and is capable of showing more than one KPI.
Filter options allow you to filter and view tasks, contacts, accounts, leads and opportunities based on any field.


