Powerful Visual Sales Timelines
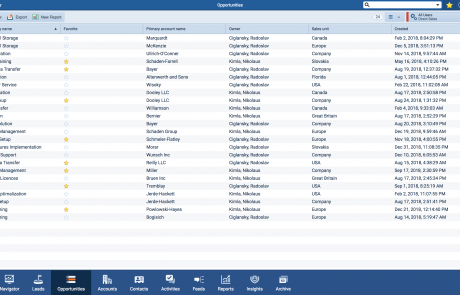
The most important feature of any CRM is its interface. When an interface is non-intuitive, showing rows and columns of numbers like a spreadsheet, it is then left to the userUser User means a person who uses or consumes a product or a service, usually a digital device or an online service. to visualize the actual pipelinePipeline Sales pipelineis a visual representation of the stage prospects are in the sales process., and opportunity progress within it.
Pipeliner, on the other hand, provides a visual view of an entire pipeline, replacing the need for toggling between different screens, as found in many other CRM applications.
The Pipeline View
In the Pipeline View, you have a graphical representation of your sales process, with its distinct sales stages. Within each sales stage, you can instantly see exactly where each opportunity lies, along with how long it’s been there if it’s overdue, its chances of coming in, and numerous other factors.
If you mouse over any opportunity, you can gain a Quick View—showing value, ranking, close date, recent and upcoming activity, and more. Similarly, you can mouse over any sales stage for a summary of that stage, including total value, number of opportunities, the average time in step, and more.
Movement of opportunities between stages is a snap—simply drag and drop opportunities from one stage to the next.
You can utilize Pipeliner’s powerful Filters feature to zero in on specific accountAccount Account refers to a record of primary and background information about an individual or corporate customer, including contact data, preferred services, and transactions with your company. types, rankings, dollar amounts, or other parameters.
Labels
For instant reference, you can label opportunities so that priorities are instantly viewed:
Focus—this is a top priority leadLead Lead refers to a prospect or potential customer (who can be an individual or organization) that exhibits interest in your service or product; or any additional information about such entity. or opportunity that should be worked right away
Hot—this is a hot lead or opportunity that should be worked as buyerBuyer A buyer is an individual or organizational entity that purchases a product or subscribes to a service. is very active
Stalled—The opportunity is stuck from the buyer point of view.
Target
To the right of the screen, always in view, is the Dynamic Target. It is a constant reflection of your up-to-the-minute progress in any given sales period, and can be utilized in 5 different target views. The Dynamic Target can also be customized to take different views of the pipeline for analysis and forecastingForecasting Forecasting is a prediction or calculation of a trend or event likely to occur in the future based on qualitative, quantitative and historical data as well as emergent but relevant factors..
Sales Step Quick View
There is crucial dataData Data is a set of quantitative and qualitative facts that can be used as reference or inputs for computations, analyses, descriptions, predictions, reasoning and planning. that applies to each of your sales steps. As with many other Pipeliner features, we have reduced it to a powerful, visual simplicity with the Sales Step Quick View.
In this view, you can see:
- Open vs. Lost—showing you the total value of the deals in that stage, as well as the value of deals that have been lost in that stage.
- Drop-Off Rate—shows you the average percentage of deals that drop off in this stage.
- Average Days in Step—shows you how long a deal is remaining in that sales step.
- Ready to Move—shows you the number of deals that are ready to move to the next sales step.
- You also have the number of velocity issues and can click through and see those.
Compact View
With the Compact View feature, you can, at a glance, view the last time a prospect was touched, the sales opportunities that involve them, and activity from their running feed (latest internal messages, social CRM updates, or emails).
The Compact View can also be applied to leads and opportunities.
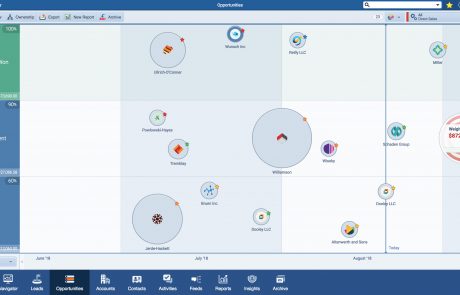
Bubble Chart View: Your 3D Sales Timeline
Sales professionals are always looking toward the future, at when which opportunities are scheduled to close. But in doing so, there must be exact relevance to the view:
- In which stage of the sales processSales Process Sales Process is a series of strategic steps or a set of activities aimed at driving sales growth through the alignment of personnel, market insight, methodologies, relevant business units, and technology. stage does the deal reside?
- What is the estimated close date?
- How big is the deal, and what are its particulars?
With Pipeliner’s 3D Timeline all of these aspects are instantly visible. Sales pipelineSales Pipeline Sales Pipeline is a type of visualization showing the status of each sales prospect in the customer life cycle or sales process. stages run up the left-hand side. The timeline runs from left to right, and the size of the deal is expressed in the size of the “bubble.” Simply mouse over or click on a bubble for a closer view of that deal.
Pipeliner CRM now brings you complete timeframe understanding – instantly, visually.
Target and Filter
As with the Pipeline View, the Dynamic Target is always visible in the Bubble Chart View. You can also utilize the same Filter technology as that used in the Pipeline View for even more analytic functionality.
Analysis Action
Within the 3D timeline you can take actions:
- Click and drag the Timeline right or left to instantly view the number of deals in any time period.
- Click and drag any deal to change its close date.
- Click and drag deals from one pipeline stage to another. Instantly create a Timeline Report.
- Opportunity Groupings – Pipeliner offers numerous choices with which you can visually and logically group opportunities, for specific on-the-spot analysis, such as ranking, company logo, and velocity.
The Pipeliner CRM Timeline is yet another feature that allows you to instantly analyze your sales future – and take action.
Some Other Highlights:
Dynamic Target Feature keeps a constant visual check on your target progress and is capable of showing more than one KPI.
Filter options allow you to filter and view tasks, contacts, accounts, leads and opportunities based on any field.
Bulk Update makes global changes to your CRM data—no need for making individual changes to accounts.
Documents needed for sales are never more than 1 click away.


