Pipeliner CRM Archive Feature
The Sad Fate of Lost Deals
Turning Losses…Into Future Wins. Often, when a deal is lost, so is most of the dataData Data is a set of quantitative and qualitative facts that can be used as reference or inputs for computations, analyses, descriptions, predictions, reasoning and planning. connected with it. What happens if, several months up the line, that deal comes back to life? All details associated with it—such as pricing, contacts, tasks, and documents—must be recompiled. It can mean a lot of work and wasted sales time.
Plus without full insight into the losses, how can you ever analyze why you are losing deals? At what sales stages are deals commonly failing? Which reps are losing them, and when? What other factors such as price or competition might be involved? If the data is lost, you cannot. To a greater or lesser extent, you are flying blind—and losing future revenueRevenue Revenue is the amount of money a business generates during a specific period such as a year or a quarter; also called sales..
The Answer: Pipeliner CRM Archive
The Pipeliner CRM Archive tool—totally unique in the CRM market—means none of the above ever happens:
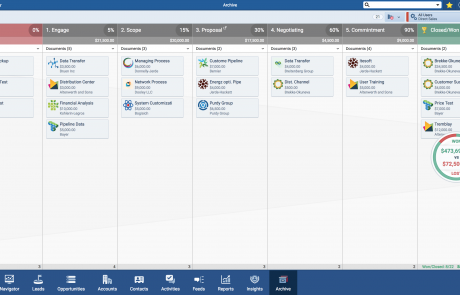
- Archived leads and opportunities are arranged exactly as in the active PipelinePipeline Sales pipelineis a visual representation of the stage prospects are in the sales process. View
- Leads and opportunities contain all information present when they were archived—including documents, emails, notes, social media interactions, tasks, and activities
- Leads and opportunities can be restored to active pipeline with 1 click.
Analysis can be conducted of lost opportunities to discover vital factors such as:
at which sales stages you are losing the most deals
which sales reps need mentoring and coaching, and in what areas
which products or price points are losing you the most deals
accuracy of close dates and lead scoringLead Scoring Lead Scoring is the process of assigning a relative value to each lead based on different criteria, with the aim of ranking leads in terms of engagement priority.
and much more…
With the Archive feature, as well as in several other features, Pipeliner takes visual analysis to a whole new level with the Opportunity Grouping Feature. Pipeliner offers numerous choices with which you can visually and logically group opportunities, for specific on-the-spot analysis, such as ranking, company logo, and velocity.
Dynamic Target Feature Now Part of Archive
Pipeliner’s Dynamic Target Feature is also available in the Archive feature. Use it to compare time periods for revenue or any other numeric metric, or to compare metricsMetrics Metrics are quantities that are measured and used to: to each other for a time period.
Compact View
You can view the last time a prospect was touched, the sales opportunities that involve them, and activity from their running feed (latest internal messages, social CRM updates or emails).
List View
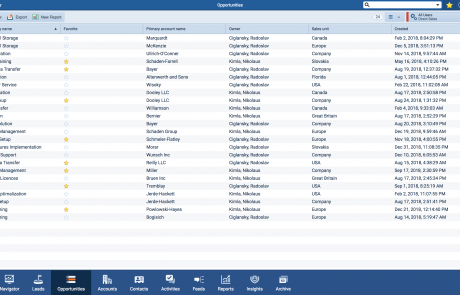
The List View feature is also available for opportunities within the Archive. You can see your archived opportunities in a column/row format, customizable for your particular needs.
Sales Step Quick View
The Sales Step Quick View is available in Archive, just as it is in the Pipeline View. There is crucial data that applies to each of your sales steps. As with many other Pipeliner features, we have reduced it to a powerful, visual simplicity with the Sales Step Quick View.
In this view, you can see:
- Open vs. Lost—showing you the total value of the deals in that stage, as well as the value of deals that have been lost in that stage.
- Drop-Off Rate—Shows you the average percentage of deals that drop off in this stage.
- Average Days in Step—Shows you how long a deal is remaining in that sales step.
- Ready to Move—Shows you the number of deals that are ready to move to the next sales step.
- You also have the number of velocity issues, and can click through and see those.
Additionally, for LeadLead Lead refers to a prospect or potential customer (who can be an individual or organization) that exhibits interest in your service or product; or any additional information about such entity. stages the Quick View shows Open vs. Lost, the Drop-Off Rate, and Average Days in Step, so you can know at a glance at how well your leads are progressing.
For your “Won” stage, you can see the total value as well as the number of won opportunities, the success rate, and the average days in the pipeline for won opportunities. This gives you a great insight into the effectiveness of your overall pipeline.
Some Other Highlights:
Dynamic Target Feature keeps a constant visual check on your target progress and is capable of showing more than one KPI.
Filter options allow you to filter and view tasks, contacts, accounts, leads and opportunities based on any field.
Documents needed for sales are never more than 1 click away.


