It’s important in any industry, but especially in the financial services industry: You need to be able to track your progress in real-time, and predict with some accuracy where you’re going.
In Pipeliner, this is done through intuitive, visual sales analyticsAnalytics Analytics is the active study of different types of data with the aim of discovering meaningful patterns and translating these into insight (such as historical analyses and forecasts), or action (such as those intended to improve business performance). that sum up to business intelligence. It is the transformation of raw dataData Data is a set of quantitative and qualitative facts that can be used as reference or inputs for computations, analyses, descriptions, predictions, reasoning and planning. into meaningful and useful information that allow you to see which opportunities are potentially profitable, which agents are performing well and which need help, and how your overall sales team is performing against your sales and revenueRevenue Revenue is the amount of money a business generates during a specific period such as a year or a quarter; also called sales. goals.
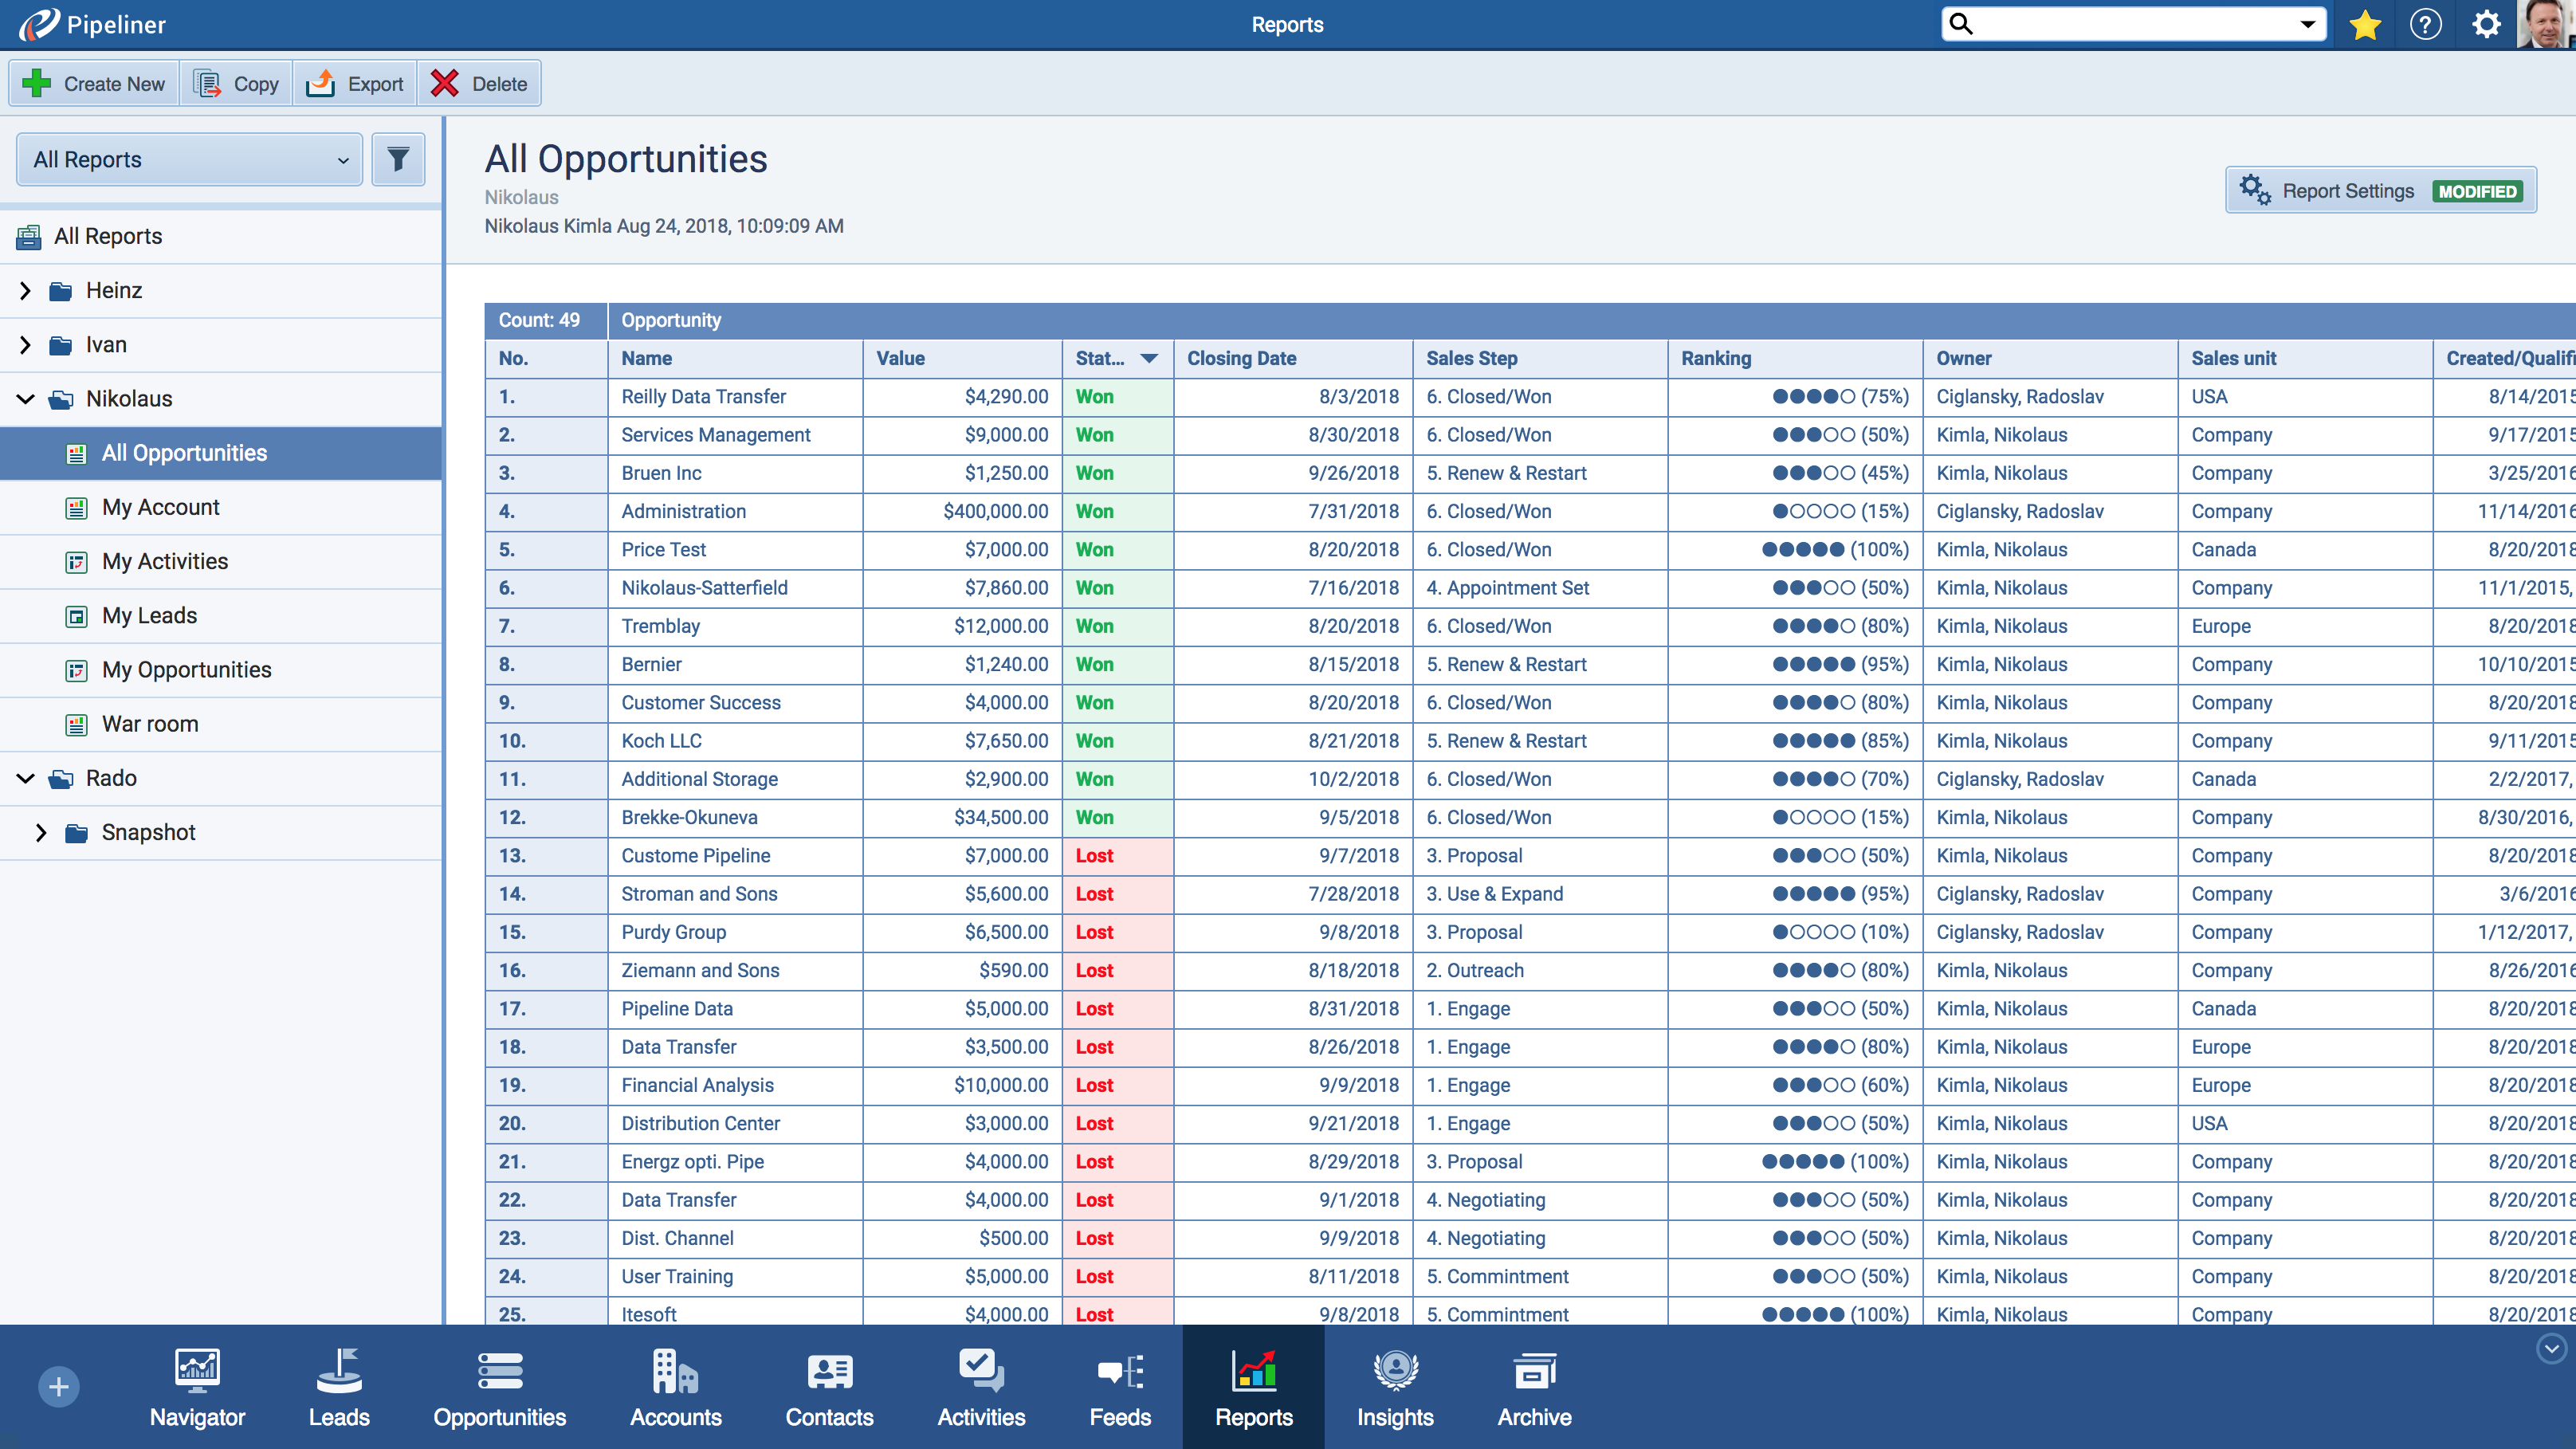
Knowing this, we have created a reporting system for Pipeliner that is totally summed up in its tagline: Instant Intelligence, Visualized!
- 1-click New Report—In any view you happen to be in within Pipeliner, with a single click you can immediately generate an on-demand management report, save it, and recreate it at any time.
- Reports allow in-depth comparisons, evaluations and statistics—all userUser User means a person who uses or consumes a product or a service, usually a digital device or an online service.-managed.
- 24 pre-formatted reports give you powerful insights into your opportunities in real time, and monitor up-to-the-minute sales performance.
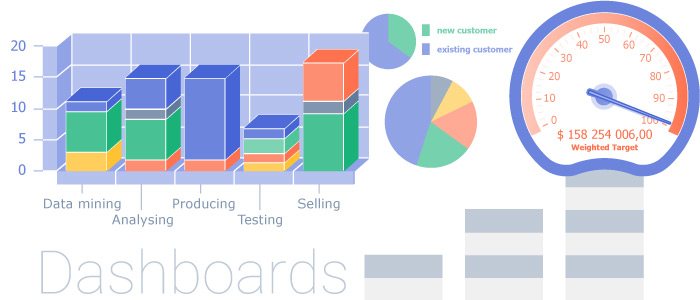
- Sales Dashboards provide insights on demand—built so that everyone on the sales team can easily see and interpret data to make better, more informed decisions.
- Drill down into the data and generate custom sales reports from multiple data sources using the Pivot Table capability.

Filters and Views
Another aspect of Pipeliner’s intuitive analytics is contained with its filters and views functionality. Within the overall pipelinePipeline Sales pipelineis a visual representation of the stage prospects are in the sales process. view of an agent, unit or overall group, you can drill down to particular views based one of any number of factors:
- A particular rep’s pipeline
- A unit, territory or particular sales group’s pipeline
- The firm’s overall pipeline
- Opportunities within a certain value range
- Opportunities with a certain likelihood of closing
- Opportunities scheduled to close within a certain time period
- Opportunities of a certain instrument or productProduct Product refers to anything (an idea, item, service, process or information) that meets a need or a desire and is offered to a market, usually but not always at a price. or service type
and many more.

